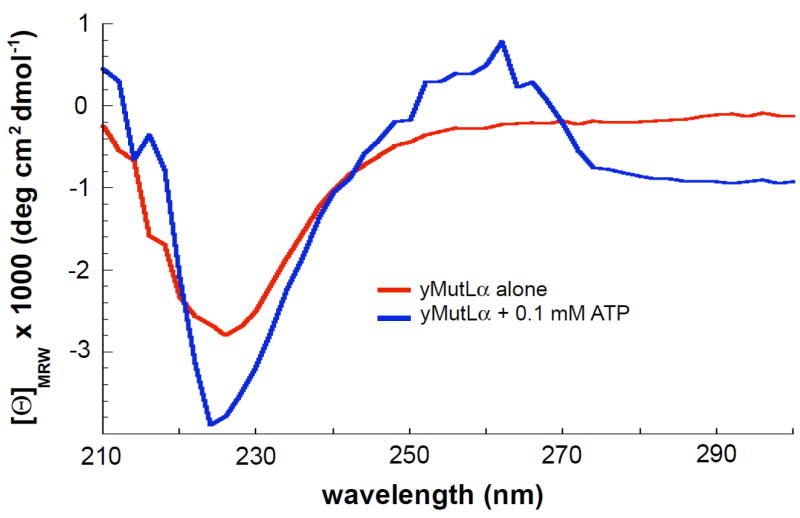
Figure 4.
CD spectra of 0.4 μM yMutLα in the absence (red) and presence (blue) of 0.1 mM ATP. The signal differences seen at 220–230 nm demonstrate that in the presence of ATP, the protein adopts more secondary structure (either α-helix or β-sheet). Plotted curves are the average of 3 experiments, with the background spectra (either imaging buffer alone or imaging buffer + 0.1 mM ATP) subtracted.

