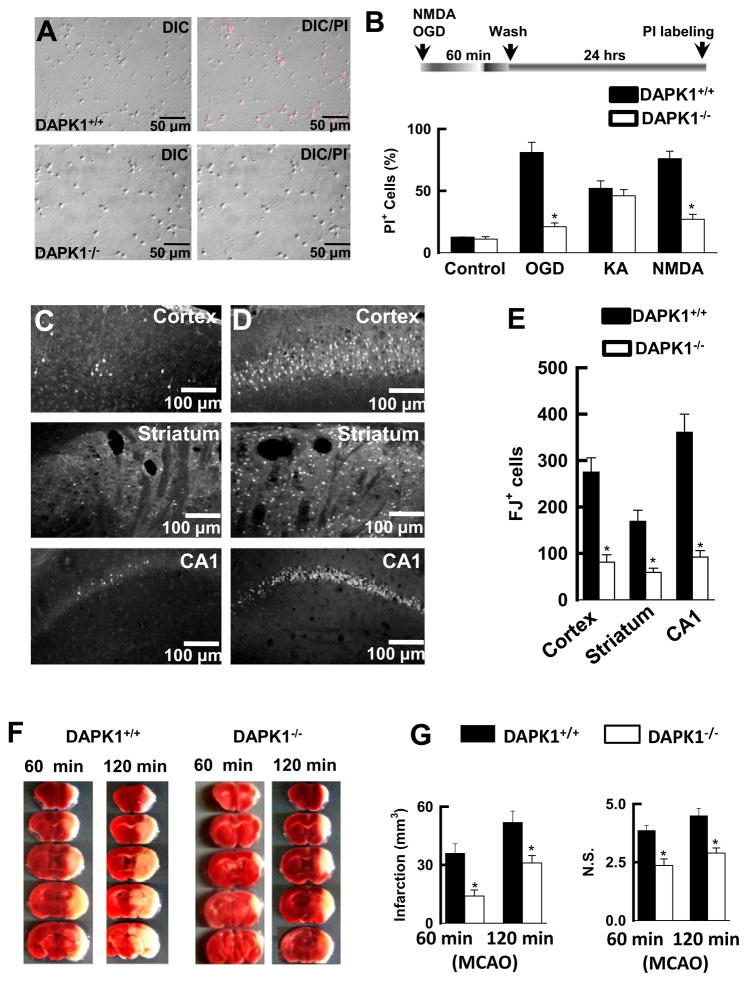
Figure 6. Genetic Deletion of DAPK1 Protects against Ischemic Neuronal Death.
(A) DAPK1 deletion protects cortical neurons against OGD insult. DAPK1+/+ and DAPK1−/− cortical cells were challenged with OGD for 60 min. 24 hr after washout the cultures were stained with propidium iodide (PI, red), and single DIC or double DIC/PI images were collected. (B) Bar graph summarizes the percentage of PI+ cells (n = 12 cultures). Data are mean ± SEM.
(C–E) Images of cortex, striatum and the hippocampus from DAPK1−/− (C) and DAPK1+/+ (D) mice that were stained with Fluoro-Jade 6 days after transient global ischemia. Bar graph (E) shows summarized Fluoro-Jade-labeled cells (n = 7). Data are mean ± SEM.
(F and G) Images of the brain sections (1.0 mm, F) from DAPK1+/+ and DAPK1−/− mice 24 hr after operation for 60 min or 120 min MCAO that were stained with TTC. Bar graphs show the infarct volume and neurological scores (N.S.). Data are mean ± SEM (*p < 0.01).

