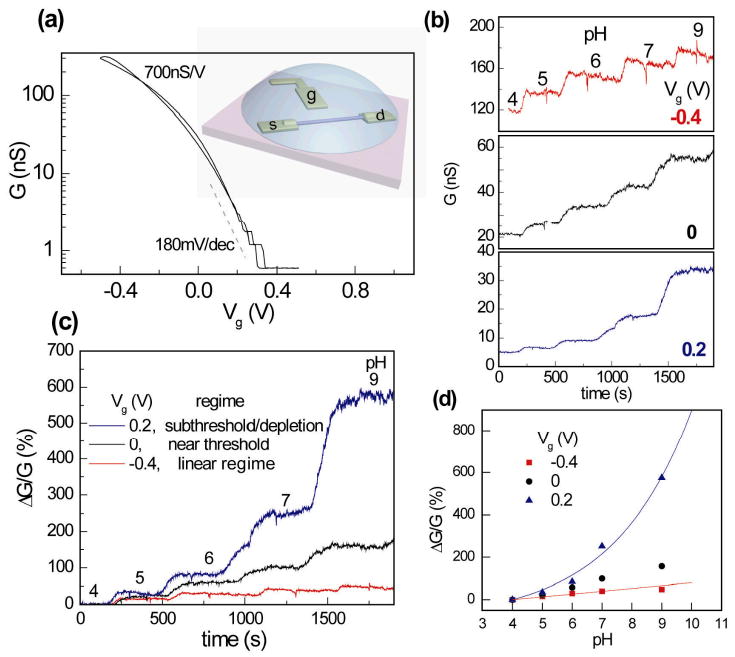
Figure 2.

pH sensing in the linear vs. subthreshold regime of a NW-FET. (a) Conductance G vs. electrolyte gate voltage Vg of a p-type silicon NW FET. The inset shows the schematic of electrolyte gating. This device has a trans-conductance ∼ 700 nS/V in the linear regime and subthreshold slope S ∼ 180 mV/decade in the subthreshold regime, with a threshold voltage VT ∼ 0V. (b) Real time conductance data G(t) for pH sensing at Vg = −0.4 V (linear regime), 0 V (near threshold voltage) and 0.2 V (subthreshold regime). (c) Real time pH sensing data in (b) plotted as the percentage change, ΔG/G, with the conductance value at pH = 4 as reference point. In the subthreshold regime (Vg = + 0.2V), the device shows much larger percentage change in conductance as solution pH changes. (d) Device conductance as a function of pH value at Vg = −0.4, 0 and +0.2V. The blue and red lines are exponential and linear responses for pH induced surface potential shift of −30 mV/pH.
