
Figure 6.
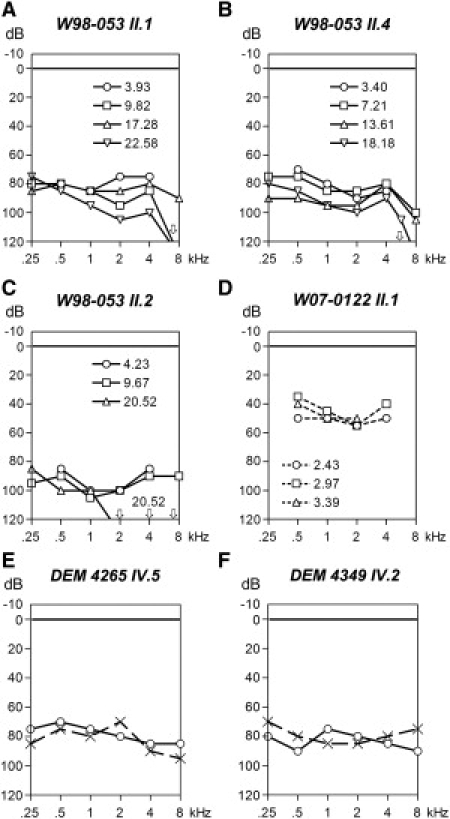
Clinical Characterization of DFNB25 Families
(A–D) Representative audiograms of the right ear of affected individuals of families W98-053 and W07-0122 at different ages. Dashed lines indicate free-field measurements.
(E and F) Representative audiograms of affected individuals of families DEM 4265 and DEM 4349, obtained at the ages of 19 and 26 yrs, respectively. Circles and crosses represent the right and left ear, respectively.