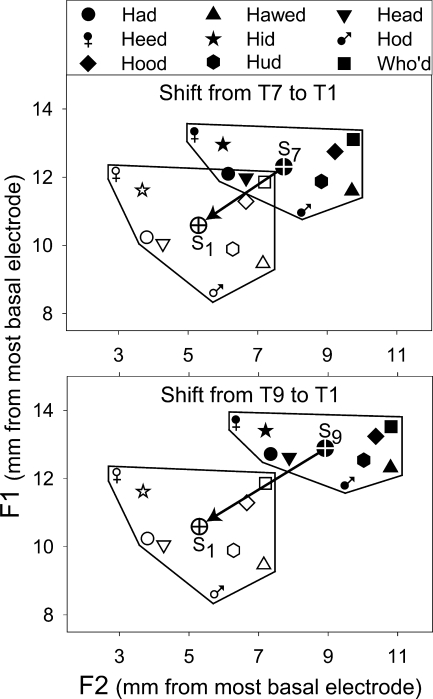
FIG. 3.
Shift in vowel stimulus center locations in the F1 vs. F2 space (in units of millimeters from the most basal electrode) after changing from the clinical map T7 or T9 (filled symbols) to the experimental map T1 (open symbols). The crossed circles show the locations of average stimulus centers S1, S7, and S9, corresponding to T1, T7, and T9, respectively.

