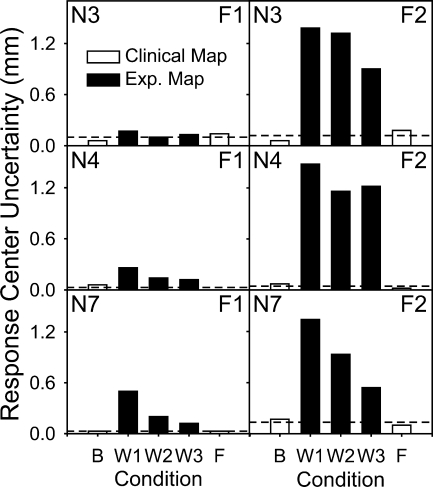
FIG. 5.
Response center uncertainty (RCU) for locations of mean formant energies F1 and F2 along the implanted electrode array, as a function of different points in time during the 3-month study period; RCUs are expressed in millimeters. Values of RCU tended to be larger with the frequency-shifted map conditions (W1, W 2, and W3) than with the clinical map conditions (Bas = baseline and Fin = final), for all subjects (N3, N4, and N7). Horizontal dashed line shows the average of baseline and final RCUs with the clinical map.

