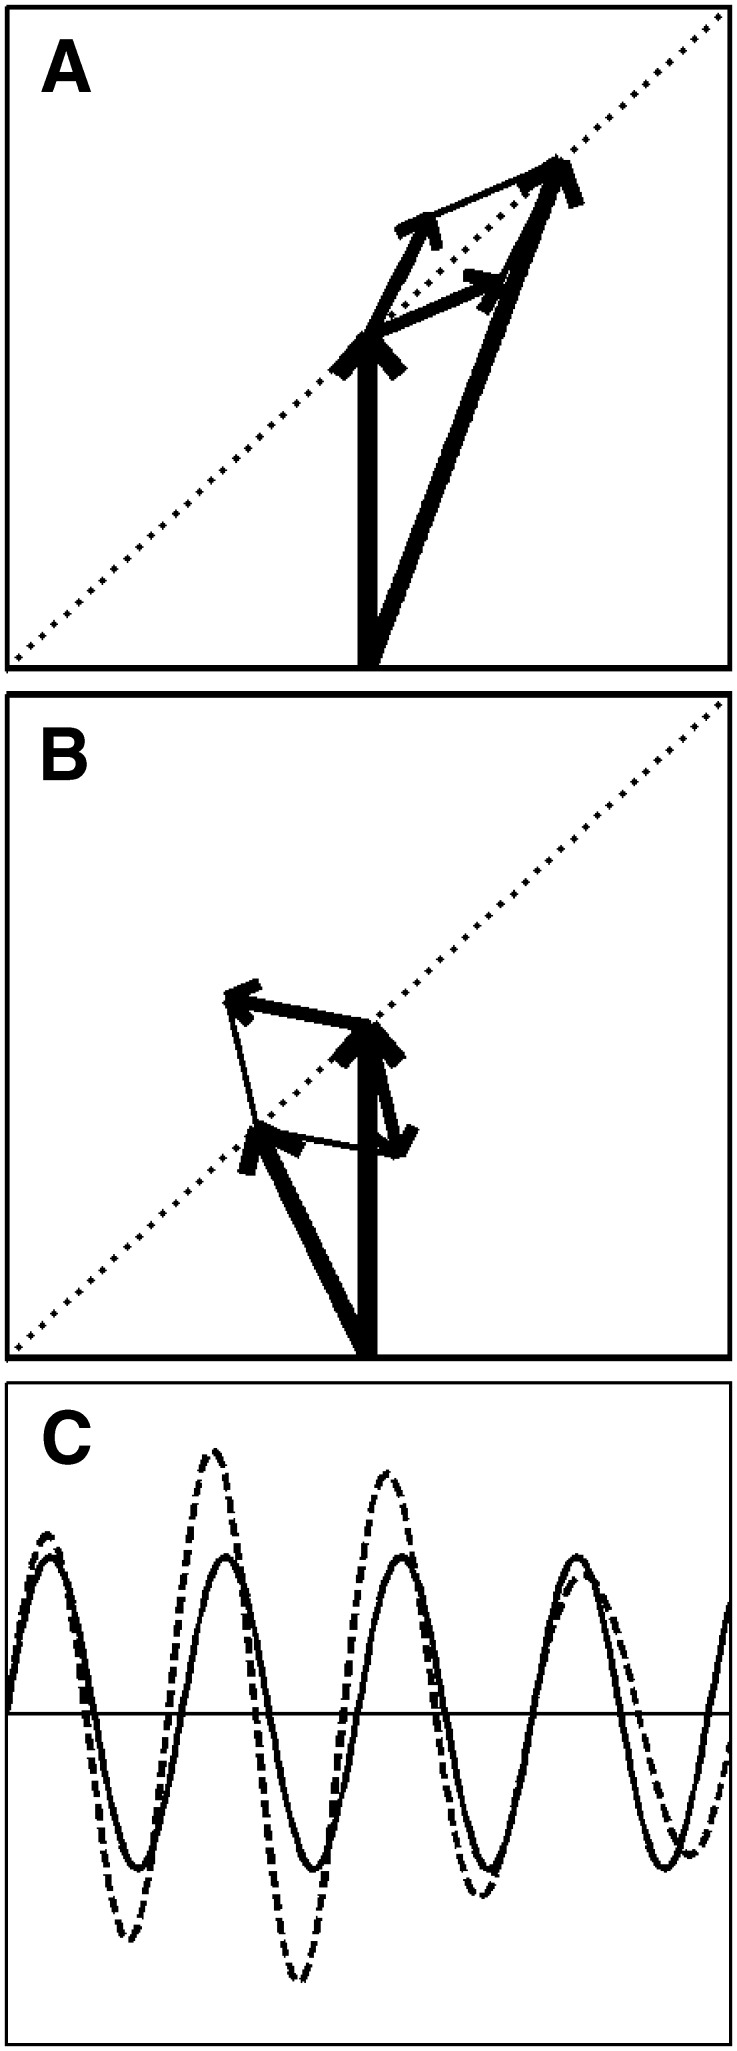
FIG. 2.
Mixed modulation. A, B Vector diagrams. The thick vertical arrow represents the carrier. The two small arrows are the sidebands, which, due to their frequencies relative to the carrier, are spinning in opposite directions. A and B Snapshots at different time instants. The initial phases are chosen such that the resultant (i.e., the sum of carrier and sidebands, indicated by the large skewed arrow) is confined to the diagonal indicated by the dotted line. C Waveforms of the unmodulated carrier (solid line) and the modulated carrier (dashed line). Note that both the amplitude and the phase (zero crossings) are affected by the modulation.

