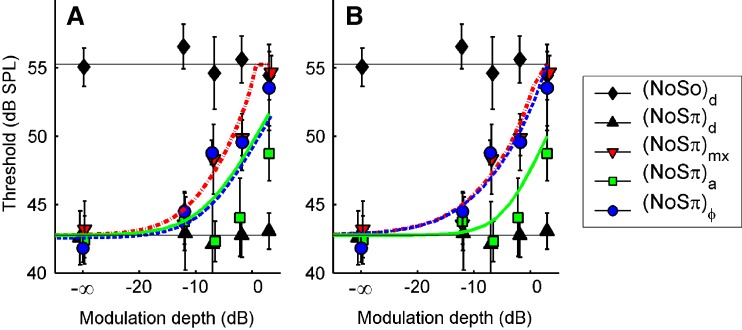
FIG. 7.
Predictions based on interaural correlation in a 100-Hz-wide noise band centered at 500 Hz (see text). Symbols are the data from listener A, replotted from Figure 5. Line styles and symbols indicate the type of binaural modulation: mixed (dash-dotted line, downward pointing triangles); binaural AM (solid line, squares), and binaural QFM (dashed line, circles). Black symbols and horizontal lines are the control conditions as in Figure 5. In A, interaural correlation was computed directly from the filtered waveforms. In B, the filtered waveforms were subjected to a compressive power law (0.25 dB/dB) prior to computing the correlation. Note that the solid and dashed lines in A coincide, because the predictions for (N0Sπ)a and  are identical. In B, on the other hand, the dashed and dash-dotted lines largely overlap, because the predictions for (N0Sπ)ϕ and (N0Sπ)mx are very similar.

