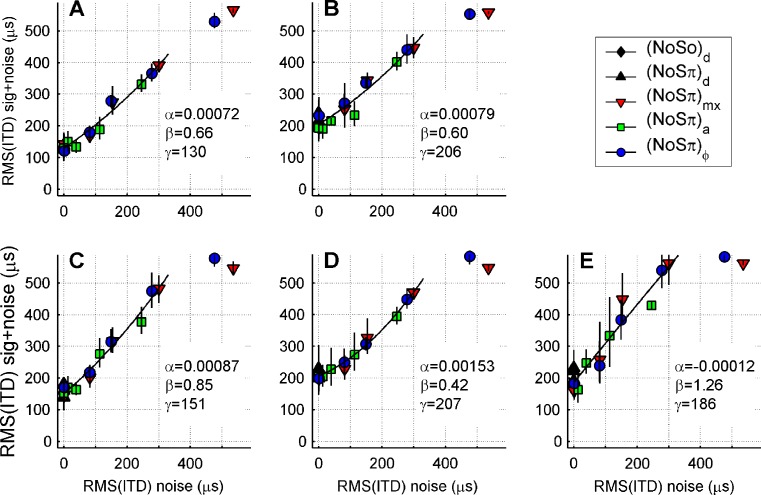
FIG. 8.
Representation of the detection thresholds of Figure 5 in terms of the size of ITD fluctuations, RMS(ITD), in a 100-Hz-wide band centered at 500 Hz. For each detection threshold the relation is shown between the RMS(ITD) of the noise-alone condition (abscissa) to the same metric extracted from the noise + signal condition at the detection threshold (ordinate). Symbols as in Figures 5 and 7. Lines are second order polynomial fits  to the data. Fit parameters are indicated in each plot. The (N0Sπ)mx and
  thresholds obtained with 3-dB modulation depth were excluded (N0Sπ)ϕ from the fits, because their MLD vanished.

