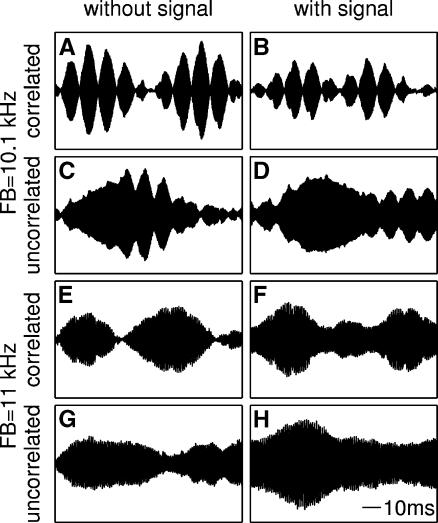
FIG. 1.
Examples of envelope fluctuations of correlated (A-B, E-F) and uncorrelated (C-D, G-H) 25-Hz narrow-band noise maskers without (left column) and with (right column) the pure tone signal present. The signal level equaled the mean SPL needed for the signal detection in the respective type of noise (i.e., at FB = 10.1 kHz: 36.4 dB SPL (correlated) and 54.1 dB SPL (uncorrelated), at FB = 11 kHz: 54.3 dB SPL (correlated) and 58.0 dB SPL (uncorrelated); noise spectrum level 40 dB SPL). Each noise masker in this figure consisted of either the OFM and a FB at 10.1 kHz center frequency (A-D) or of the OFM and a FB at 11 kHz center frequency (E-H). At a frequency separation of 100 Hz, the envelopes in both the correlated (A-B) and—to a smaller extent—the uncorrelated (C-D) noise show regular peaks and valleys at a modulation rate of 100 Hz in addition to the slow fluctuation of the 25 Hz noise bands. At a frequency separation of 1 kHz (E-H), however, the 1-kHz beating is too fast to be resolved by the auditory system and only the inherent fluctuation of the 25 Hz noise bands can be seen. Adding the 10-kHz signal to the noise results in a partial “filling” of the envelope minima (e.g., see Fig. E-F) and can be used as a cue for the detection of the signal.

