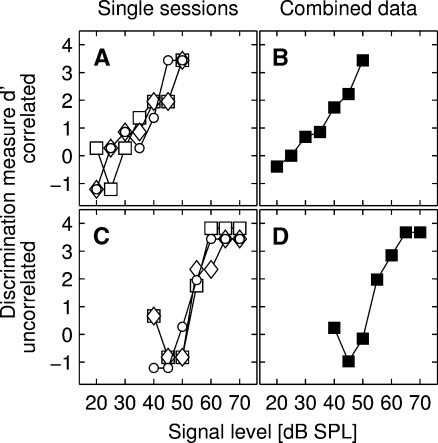
FIG. 2.
Single psychometric functions (pmfs) and the corresponding combined pmfs of a representative subject obtained for the 9.9-kHz FB condition showing the response probability (plotted as the discrimination measure d-prime or d′) in relation to the SPL of the signal. Panels A and B show the pmfs for the correlated masker condition, panels C and D show the pmfs for the uncorrelated masker condition. The different symbols in panels A and C depict the three single pmfs; panels B and D show the respective corresponding combined pmf. The threshold criterion was a d-prime of 1.8. Please note that all pmfs were plotted in such a way that the x-axis is the same in all conditions, clearly showing that the pmfs in the correlated and uncorrelated condition are shifted along the x-axis.

