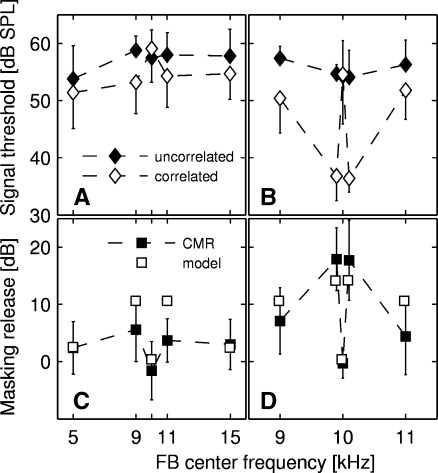
FIG. 3.
Mean signal thresholds for up to 14 NMRI mice for the detection of a 10-kHz tone masked by 25-Hz narrow-band noise as a function of the center frequency of the FB (filled diamonds: uncorrelated noise bands, open diamonds: correlated noise bands, filled squares: CMR). Error bars show the standard deviation across subjects. The left column (panels A and C) depicts the results for the standard conditions for 14 subjects. The right column (panels B and D) shows a close-up of the results of FB conditions between 9 and 11 kHz for the three subjects tested with all conditions, including the additional FB conditions 9.9 and 10.1 kHz. Panels A and B show the signal threshold for the uncorrelated and correlated conditions; the filled symbols in panels C and D show the amount of masking release, i.e., the threshold difference between the uncorrelated condition and the correlated condition. The open symbols in panels C and D show the predictions calculated on the basis of the model by Buschermöhle et al. (2007) applied to the mouse.

