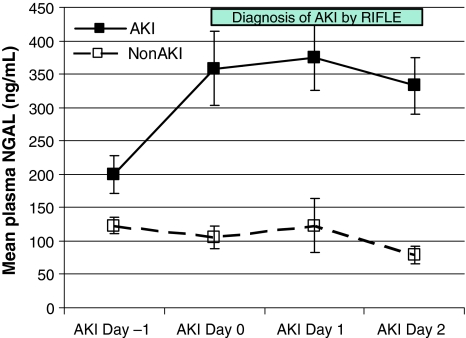
Fig. 2.
Mean plasmaNGAL concentrations at various timepoints in patients with (solid squares) and without (open squares) acute kidney injury (AKI). For AKI patients, the X-axis shows AKI Day. AKI Day 0 is the day in which the diagnosis of AKI was first made based on the RIFLE criteria. The green bar indicates the days when there is AKI. For non-AKI patients, the X-axis represents consecutive NGAL collection days. Patients who never developed AKI had comparatively lower plasma NGAL values without notable variation (P < 0.001 at each time point). Error bars are SEM

