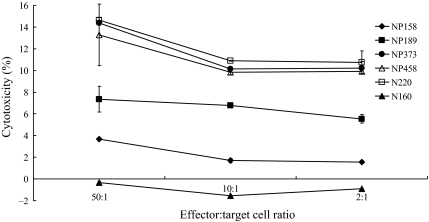
Figure 3.
A graph showing the percentage of specific killings of the target peptide-loaded T2 cells after immunization. Mice were immunized with NP158HHDpBudCE4.1, NP189HHDpBudCE4.1, NP373HHDpBudCE4.1, NP458HHDpBudCE4.1, and N220HHDpBudCE4.1, respectively, by gene gun delivery for three times at 1-week intervals. One week after the last immunization, splenocytes were collected and cultured with the corresponding peptides for 5 days. The splenocytes were subsequently incubated with the corresponding TDA-labeled peptide-loaded T2 cells at ratios of 50:1, 10:1, and 2:1, respectively, for 1 h. The culture media were collected and the fluorescent signals from the dead peptide-loaded T2 cells were detected by a Delfia EuTDA cytotoxicity detection kit and the cytotoxicity was calculated. The x-axis indicates the different ratios of the effector cells (splenocytes) to the target cells (TDA-labeled peptide-loaded T2 cells). The y-axis indicates the percentage of cell cytotoxicity. The cytotoxicity for the six groups of splenocytes vaccinated with the various plasmids was indicated as follows: NP158HHDpBudCE4.1 (-♦-), NP189HHDpBudCE4.1 (-■-), NP373HHDpBudCE4.1 (-●-), and NP458HHDpBudCE4.1 (-△-). N220HHDpBudCE4.1 (-□-) was used as a positive control. Splenocytes obtained from the mice vaccinated with the plasmid, N220HHDpBudCE4.1, but tested with N160-loaded T2 cells (-▲-), was used as a negative control. The results represent the mean ± SE (n = 3).

