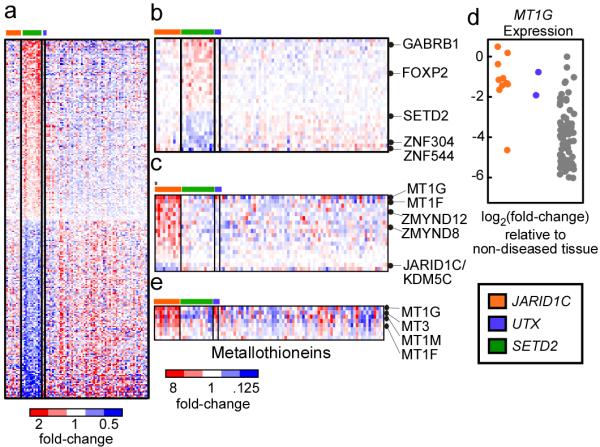
Figure 2. Gene deregulation in SETD2 and JARID1C/KDM5C mutant samples.

A. Genes (n=298) that are deregulated in tumor samples that contain non-synonymous SETD2 mutations (n=13) versus samples that lack such mutations (n=77) are plotted as a heatmap. Red color indicates increased gene expression compared to the average expression in the tumor samples, blue color indicates decreased gene expression. B. The most significantly deregulated genes in the SETD2 mutant samples. C. Heatmap of genes (n=18) that are deregulated in tumor samples that contain non-synonymous JARD1C/KDM5C mutations (n=10) versus samples that lack such mutations (n=80). The asterisks (*) highlights the sample containing the S1222P mutation. D. Expression of the MT1G gene in the tumor samples. Expression values are shown relative to non-diseased tissue and log2-transformed such that a log2-transformed value of −2 is equivalent to a 4-fold decrease in expression relative to non-diseased kidney. E. Metallothionein genes (n=8) were isolated examined for deregulated expression in JARID1C and UTX mutant samples. Significantly deregulated genes are indicated.
