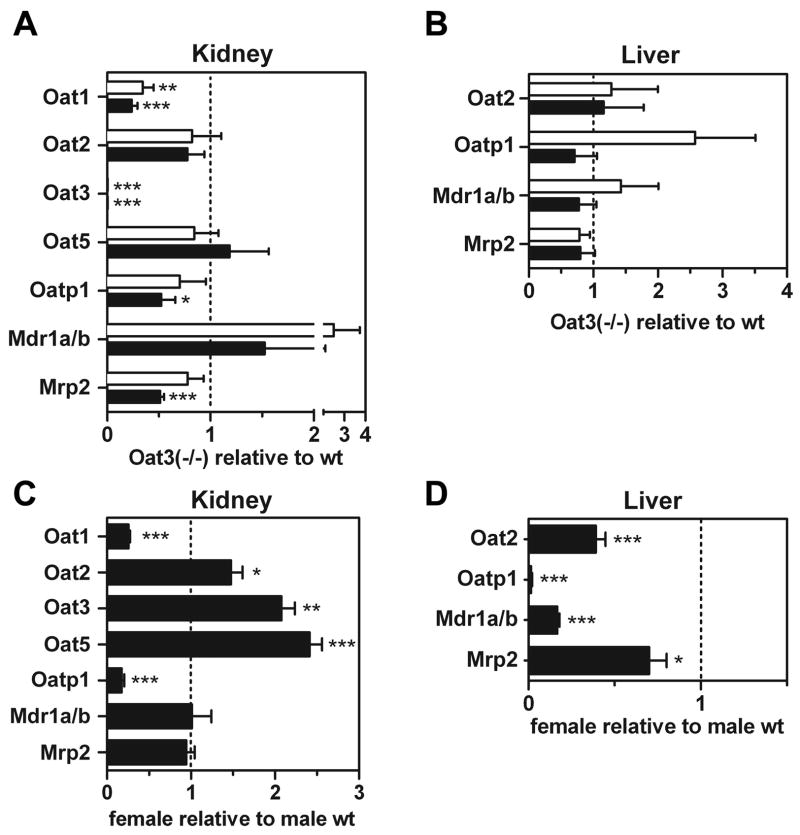
Fig. 8.
Quantitative PCR (QPCR) determination of transporter mRNA levels in Oat3(−/−) and wild-type male and female mice. Transporter expression levels were determined in kidney and liver from 6-mo-old mice by QPCR. A: renal transporter levels in knockout relative to wild-type animals. Open bars, females; closed bars, males. B: hepatic transporter levels in knockout relative to wild-type animals (open bars, females; closed bars, males). C: renal expression levels in female wild-type relative to male wild-type animals. D: hepatic expression levels in female wild-type relative to male wild-type animals. Values are mean mRNA levels relative to comparator ± SE; n = 6 for each bar. Asterisks represent significant differences from unity (dotted line) by t-test (*P < 0.05, **P < 0.01, ***P < 0.001).

