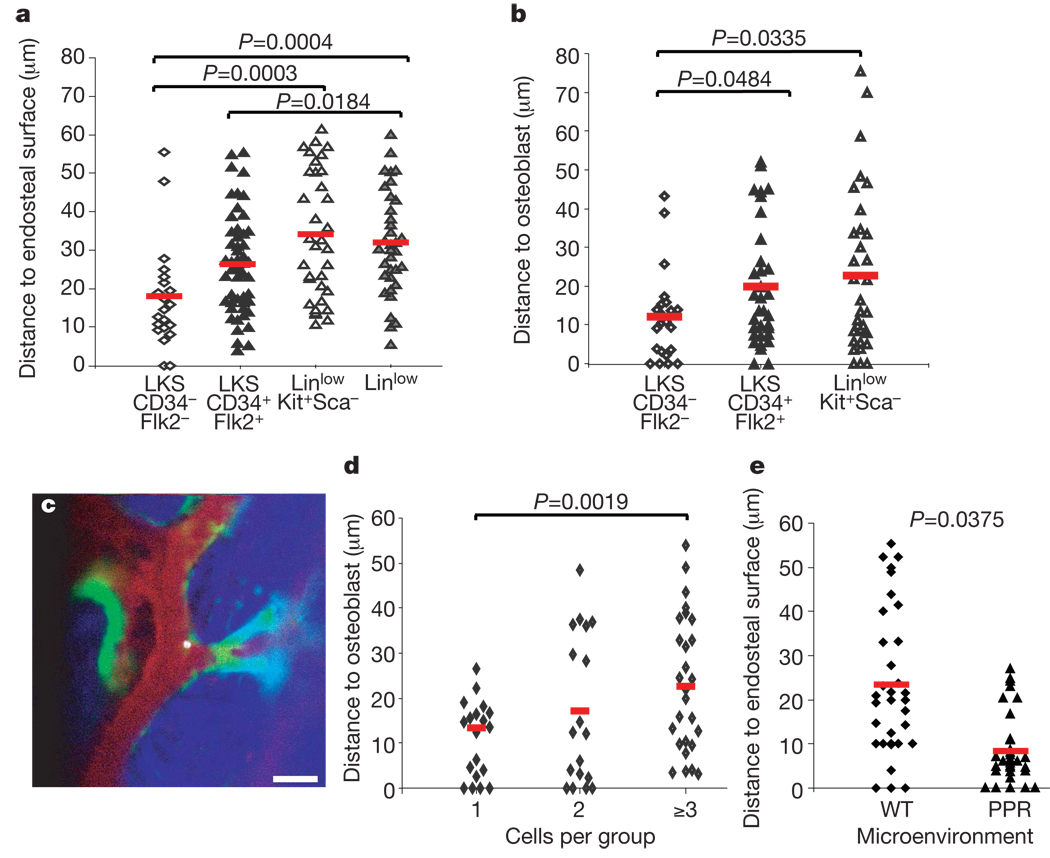
Figure 4. Cell-dependent and niche-dependent HSPC localization.
a, b,LKS CD34−Flk2− (n = 6 recipients) LT-HSC-enriched, LKS CD34+FLk2+ MPP (n = 3 recipients), LinlowKit+Sca− progenitors (n = 3 recipients) and Linlow (n = 4 recipients) populations home to distinct locations, closer to or further from endosteum (a) and osteoblasts (b). All imaging was performed within 5 h of transplantation. c, Representative image of a LKS CD34−Flk2− cell residing adjacent to an osteoblast and close to endosteum 4 h after injection. White, DiD-labelled cell; green, GFP+ osteoblasts; red, Qdot vascular dye; blue, bone collagen. Scale bar: 50 µm. d, Independently of the LT-HSC-enriched starting population, the distance between DiD-labelled cells and osteoblasts measured 2 days after injection increased with the number of cells found in each observed cluster (n = 5 imaged mice). e, Two days after injecting the same number of LKS cells in irradiated wild-type or PPR mice (n = 2 + 2) similar numbers of cells were observed, but LKS progeny in PPR mice were preferentially located adjacent to the endosteal surface. Red lines indicate the mean of all measurements in each set of experiments.

