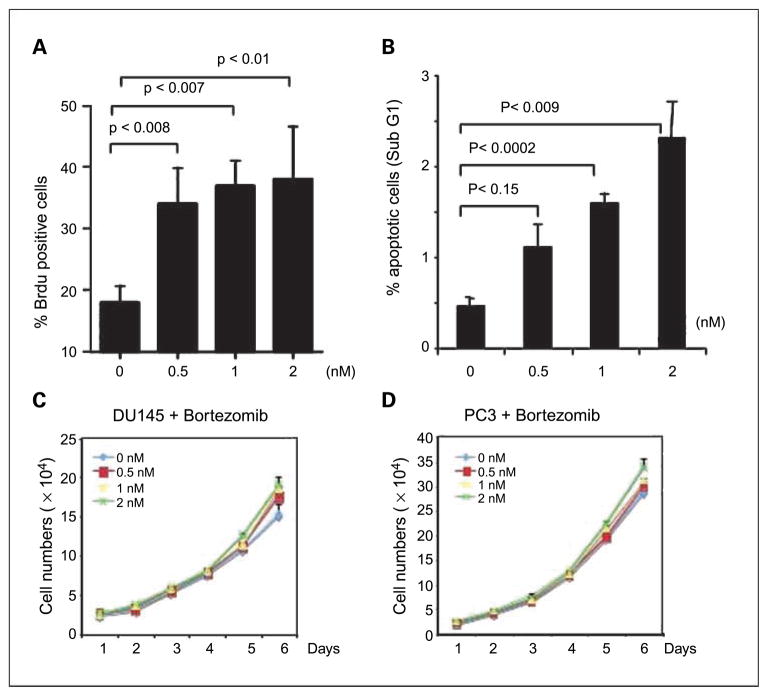
Fig. 3.
In vitro effects of bortezomib on growth, proliferation, and apoptosis. DU145 cells were inoculate in a 4-well chamber slide (Lab-Tek II; Fisher) at a density of 3 × 10⁴ per well and incubated overnight, and bortezomib was added at the indicated concentration for 48 h. BrdUrd labeling and detection was done as described in Materials and Methods. A, the percentage of BrdUrd-positive cells represents the average of four random microscopic fields from experiment 2. Columns, mean; bars, SD. 0 μmol/L, 19.5% ± 2.7%; 0.5 μmol/L, 29.6% ± 3.9%; 1 μmol/L, 28.2% ± 5%; 2 μmol/L, 29.8% ± 5.1%. B, DU145 cells were inoculated at 1-well chamber slide (Lab-Tek II; Fisher) overnight, and bortezomib was added at the indicated concentration for 48 h. Apoptosis was assessed by the percentage of sub-G1 cells though DNA content by flow cytometry, relative to untreated cells. Experiments were done in triplicate. Du145 (C) and PC-3 (D) cells were seeded at an initial density of 1.5 × 10⁴ per well in the 2-well chamber slide. Twenty-four hours later, bortezomib was added at the final concentration of 0, 0.5, 1, and 2 nmol/L. Viable cell number was determined from the next day (as indicated as day 1) for 6 d by hemacytometer counts of trypan blue – excluding cells. Points, mean (n = 3); bars, SD. The differences in growth are more noticeable with increasing time and greater with increasing doses. Differences were significant on day 6.

