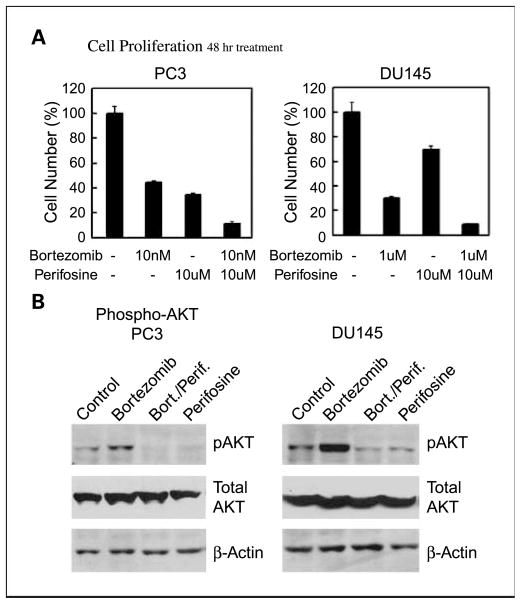
Fig. 6.
Combination treatment of prostate cancer cell lines with bortezomib and perifosine. A, PC3 or DU145 cells were treated for 48 h with the indicated concentrations of bortezomib and/or perifosine or vehicle only, and counted after staining with trypan blue. Cell number relative to controls treated with vehicle only (100%) are indicated. B, cell lysates were prepared from cells treated as described in (A) and levels of P-Akt (Ser 473) determined by Western blotting. Actin loading control is shown. All Figures: Box plots were used for nonparametric data and show the median (line), interquartile range (the box includes the middle 50% of observations), and whiskers extend out to the farthest points that are not outliers. These plots allow the reader to visually compare distributions of the variables.

