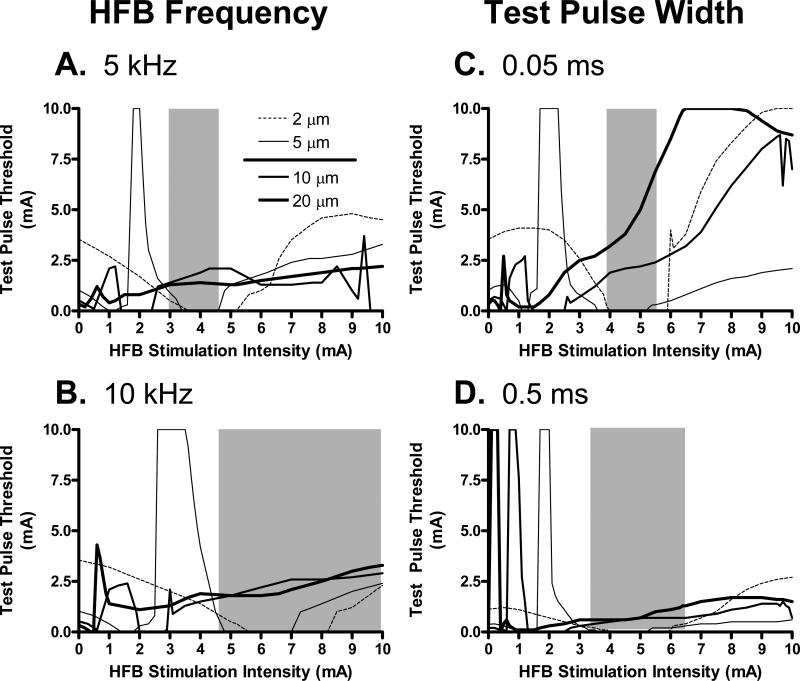
Fig. 4.
Selective activation of the small axon group (2-5 μm) without activation of large axon group (10-20 μm) is influenced by HFB stimulation frequency (A and B) and test pulse width (C and D). The legend in A also applies to B, C, and D. Small and large axon groups are separated by a solid line in the legend. The region marked by the grey area in each figure indicates the HFB stimulation intensity range where the test pulse threshold for the small axon group is smaller than the threshold for the large axon group. In A and B, the test pulse width is 0.05 ms. In C and D, the HFB stimulation frequency is 6 kHz.

