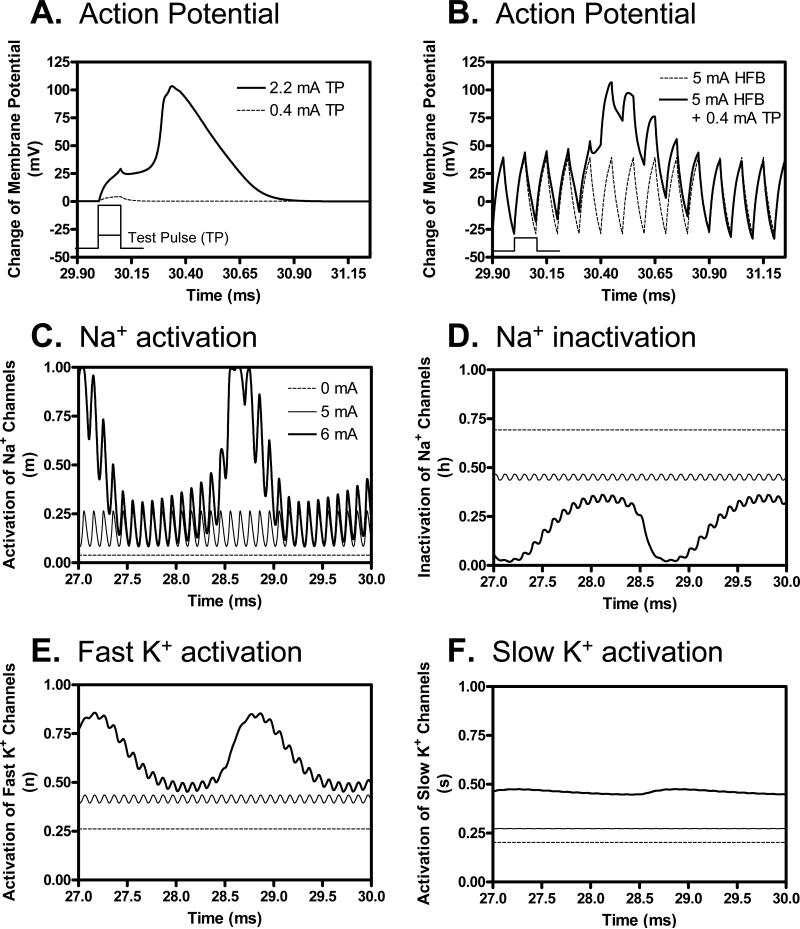
Fig. 6.
Mechanism underlying the increase of axon excitability shown in Fig. 2A as the HFB stimulation intensity increases from 0 mA to 6 mA. A 0.4 mA sub-threshold test pulse (A) induced an action potential after 30 ms modulation by a 5 mA, 10 kHz HFB current (B). Test pulse is schematically plotted in A and B to show the timing. The ionic channel activities just before the application of test pulse (27-30 ms) at the node under the electrode are shown in C-F at different intensities of HFB current (0-6 mA). The legend in C also applies to D-F. HFB frequency: 10 kHz; Axon diameter: 2 μm.

