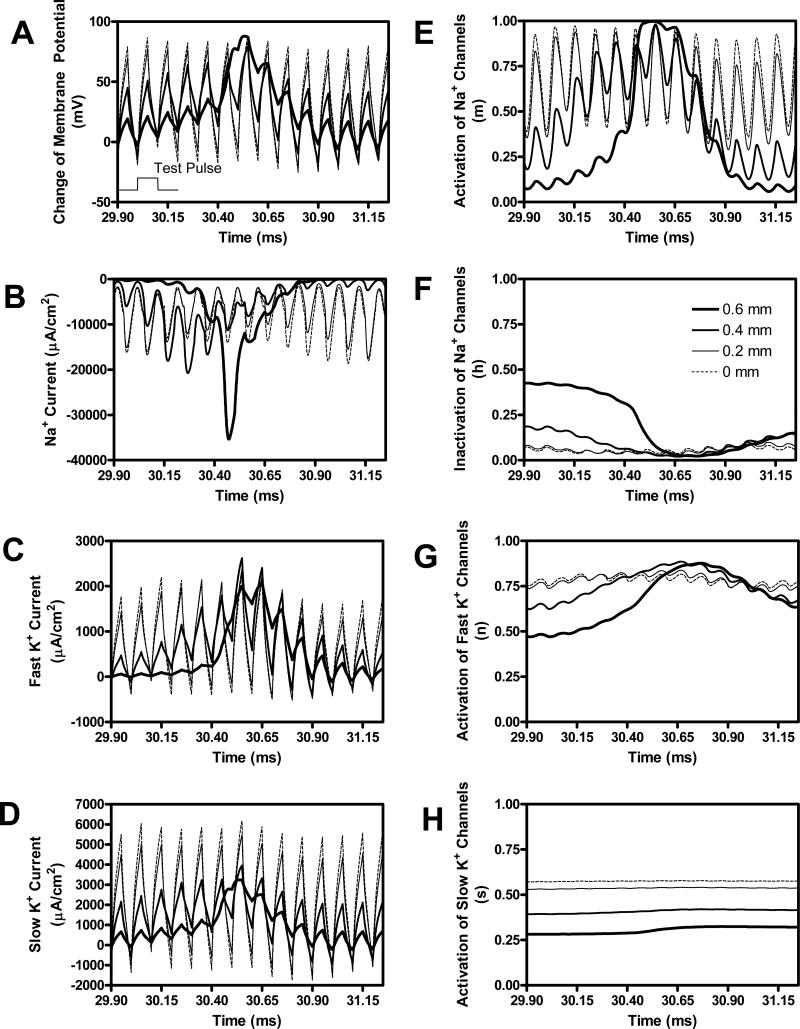
Fig. 8.
Site of action potential initiation induced by the test pulse as shown in Fig. 2D is at a nearby node close to the stimulation electrode. The legend in F indicates the distance of the node from the stimulation electrode. The thinnest dashed line (0 mm) corresponds to the node under the electrode (i.e. at 30 mm location). The thickest solid line (0.6 mm) corresponds to the node at the greatest distance from the electrode (i.e. at 29.4 mm location). The test pulse is shown in A to indicate the timing. Test pulse intensity: 0.9 mA; Test pulse width: 0.1 ms; HFB stimulation intensity: 9 mA; HFB stimulation frequency: 10 kHz; Axon diameter: 2 μm.

