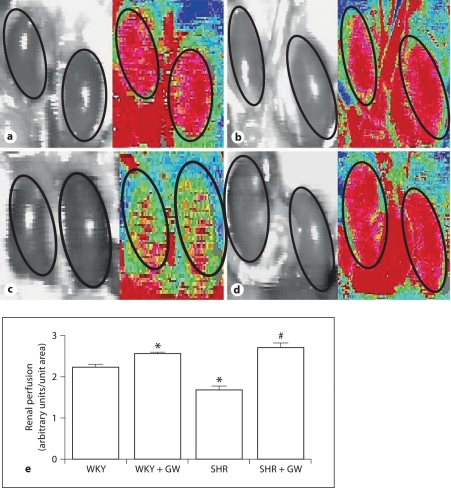
Fig. 2.
Representative scan (a–d) and quantification of whole kidney perfusion (e) measured by laser scanner in WKY (a), WKY + GW1929 (b), SHR (c) and SHR + GW1929 (d). Rats were treated with GW1929 (0.5 mg/kg) or their vehicle for 2 months. Values are mean ± SEM (n = 6–8 rats/group). * p < 0.05 versus WKY; # p < 0.05 versus SHR.

