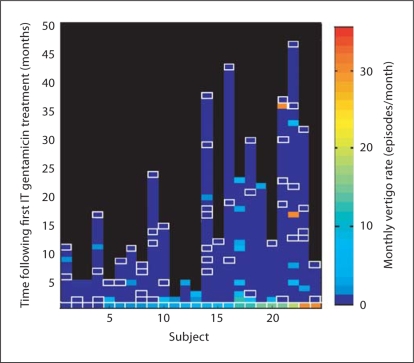
Fig. 1.
Vertigo rates after the first IT gentamicin treatment. Pre-treatment vertigo rates are shown at time 0 for each of 24 patients, and post-treatment rates are shown at later time points. White-bordered boxes indicate reported vertigo rates of 0. For boxes indicating a non-zero frequency of vertigo, the duration of time with this frequency of vertigo attacks and the actual number of attacks are not depicted; rather, the rate is expressed as a point measure at the time of retreatment.

