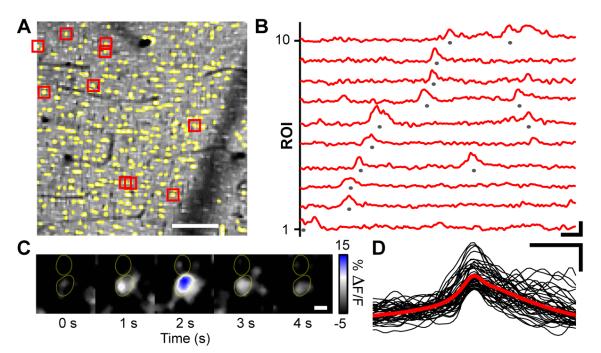
Figure 3. Sparkles Are Ongoing Ca2+ Transients That Appear in Individual Palisade Fibers.
(A) OGB-1-AM image showing cellular structures in a superficial region of the cerebellar molecular layer. Ca2+ dynamics were analyzed in regions of interest (ROI) where palisade fibers (yellow) had been identified by SR101 co-staining. Example traces of relative increases in OGB-1-AM fluorescence, ΔF(t)/F, from 10 ROIs marked red are shown in (B). Scale bar: 50 μm.
(B) Traces of Ca2+ signals from individual palisade fiber ROIs show examples of sparkles, defined as events of >10% ΔF(t)/F (marked by gray dots) for purposes of analysis. Traces are arranged by sparkle onset time. Scale bars: 5 s, 10% ΔF(t)/F.
(C) High magnification OGB-1-AM ΔF(t)/F images showing a Ca2+ sparkle in one out of two neighboring palisade fibers, whose perimeters (yellow outlines) were determined from the simultaneously acquired SR101 images. Scale bar: 3 μm.
(D) Overlay of 45 individual sparkle time courses (black) and an averaged trace (red) for sparkles that occurred within the yellow ROIs in (A). Scale bars: 5 s, 10% ΔF(t)/F.

