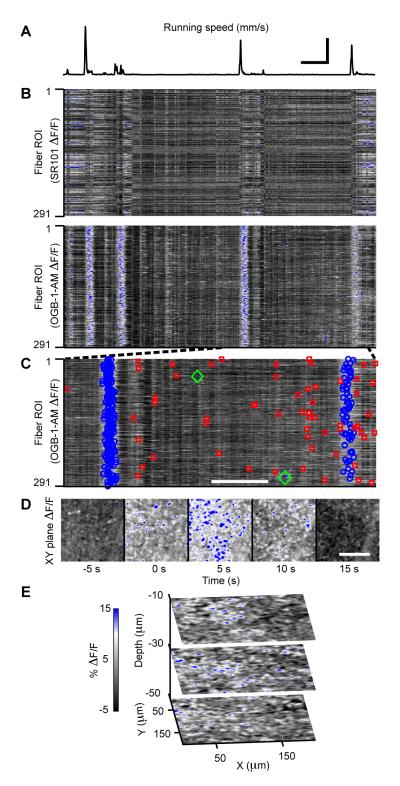
Figure 5. Motor Behavior Evokes Concerted Ca2+-Excitation Across Bergmann Glial Networks.
(A) Encoder trace of the exercise ball’s rotational speed, showing multiple running bouts during an example 9.8 min period. Scale bars: 50 s and 20 mm/s; the former also applies to (B).
(B) Top, SR101 ΔF(t)/F traces from 291 palisade fiber regions of interest (ROI) during the same time interval as in (A). Bottom, the same palisade fiber ROIs in OGB-1-AM images reliably exhibit concerted ΔF(t)/F increases, flares, during running. Signals of similar magnitude and time course are absent in ΔF(t)/F traces of non-functional indicator SR101. ΔF(t)/F scale bar in E also applies to B-D. ROIs were sorted by x coordinate.
(C) OGB-1-AM ΔF(t)/F traces over the interval indicated in (B) by dashed lines. Flares are marked blue and are interleaved in time with sparkles (red) and bursts (green). Scale bar: 50 s.
(D) Image frames of OGB-1-AM ΔF(t)/F increases relative to movement onset during the first flare in (C) illustrating the broad spatial extent of flares. Scale bar: 100 μm.
(E) Images from a 3D recording of ΔF(t)/F increases during a flare. Indicated depth values were measured relative to the pial surface.

