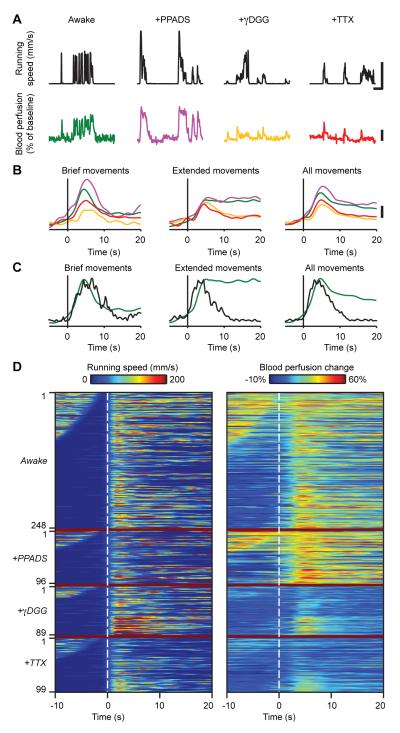
Figure 7. Temporal Relationships of Ca2+ Flares to Locomotor Evoked Blood Perfusion Increases.
(A) Example traces showing blood perfusion increases (bottom) as a function of locomotor activity (top), under four conditions, awake-untreated (green), PPADS-(purple), γDGG- (orange) and TTX-treated (red). Data for each drug condition are from a different individual mouse. Upper scale bars, 50 s and 150 mm/s. Lower scale bar, 20 %.
(B) Population data showing overlay of average blood perfusion increases in untreated (green; n = 134; 11 mice), PPADS- (purple; n = 47; 3 mice), γDGG- (orange; n = 45; 4 mice), and TTX-treated mice (red; n = 35; 3 mice) triggered upon movement onset for brief (left), extended (center), and all movements (right). Traces from each trial were normalized by the peak running speed in that trial, prior to averaging. Note that TTX and γDGG reduce the amplitude of blood perfusion increases and reduce their persistence during extended running periods. Scale bar, 10 %.
(C) Overlay of average Ca2+ flare activation (black) and blood perfusion increase (green), triggered on movement onset (vertical lines), reveals similar kinetics during locomotor initiation in the untreated condition. Flares are not sustained during extended movements, but blood perfusion increases are. Flare traces are based on a set of 187 running bouts with peak running speeds >100 mm/s in 15 mice.
(D) Sets of paired traces of running speed (left) and corresponding blood perfusion increases (right) in untreated (n = 134; 11 mice), PPADS- (n = 47; 3 mice), γDGG- (n = 45; 4 mice), and TTX-treated mice (n = 35; 3 mice). Dashed lines indicate movement onset. For each condition, traces are ordered by the pause duration after the prior movement. TTX and γDGG particularly reduce the persistence of perfusion increases.

