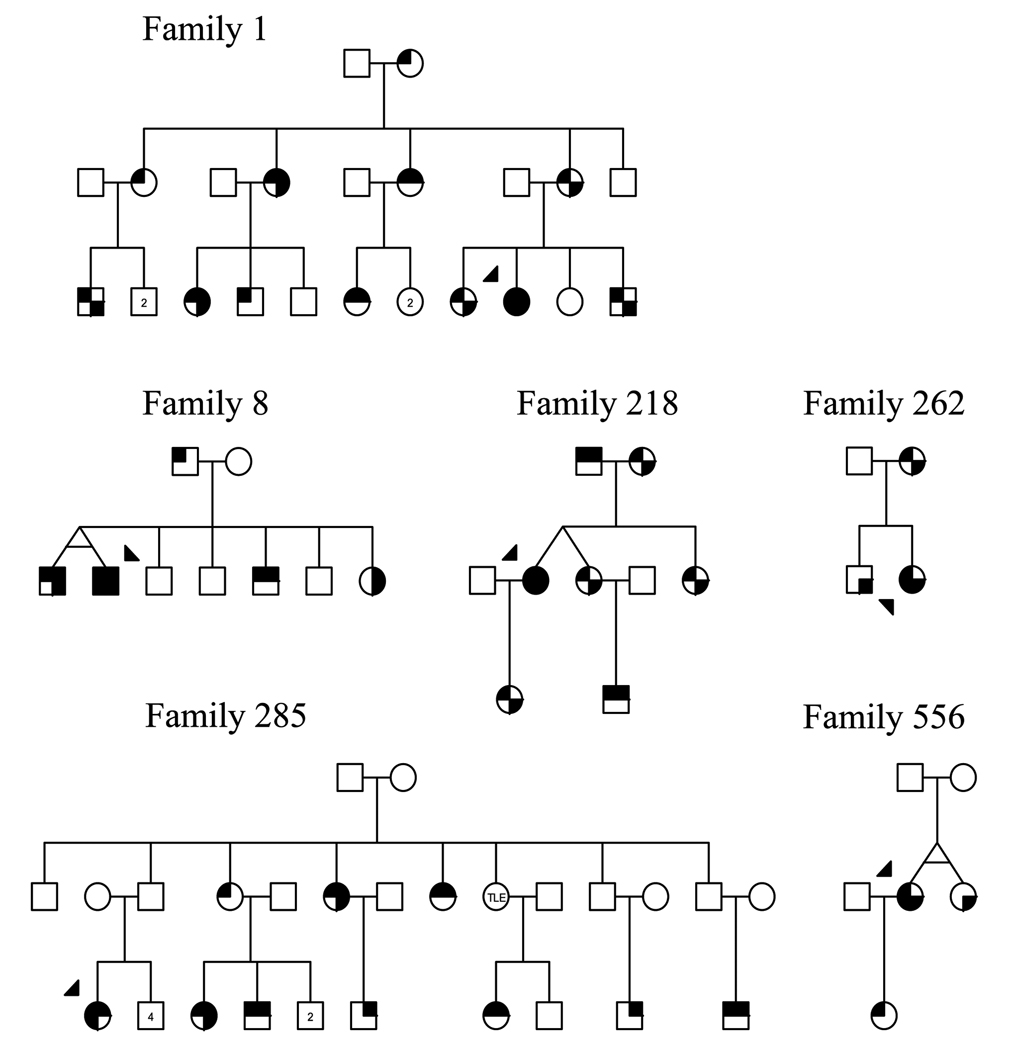
FIG. 1.
Diagram showing pedigrees of families with migraine, episodic vertigo, and Ménière’s disease. Female family members are represented by circles; male family members by squares. Index patients are indicated with an arrowhead. Affected status is indicated by shading in of quadrants according to the following scheme: upper left, migraine; upper right, aura (visual or somatosensory); lower left, hearing loss; lower right, episodic vertigo. Numbers within the circles or squares indicate the number of unaffected individuals in the sibship. TLE indicates temporal lobe epilepsy.

