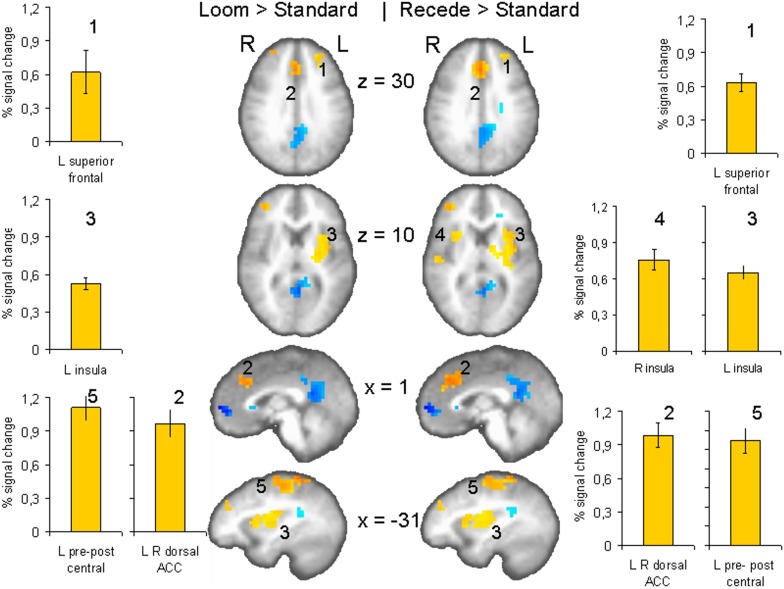
Figure 3.
fMRI: LOOM > STANDARD, RECEDE > STANDARD. Brain regions with significantly greater activation (yellow to red voxels) for the LOOM > STANDARD (left) and the RECEDE > STANDARD (right) contrasts. Activation is depicted in axial (row 1 and 2 of brain slices) and sagittal views (row 3 and 4); percent signal change is plotted (mean; SEM) as obtained through t-tests (P < 0.001, corrected). Numbers in slices correspond to numbers in bar charts representing average percent signal change in specific regions of interest.

