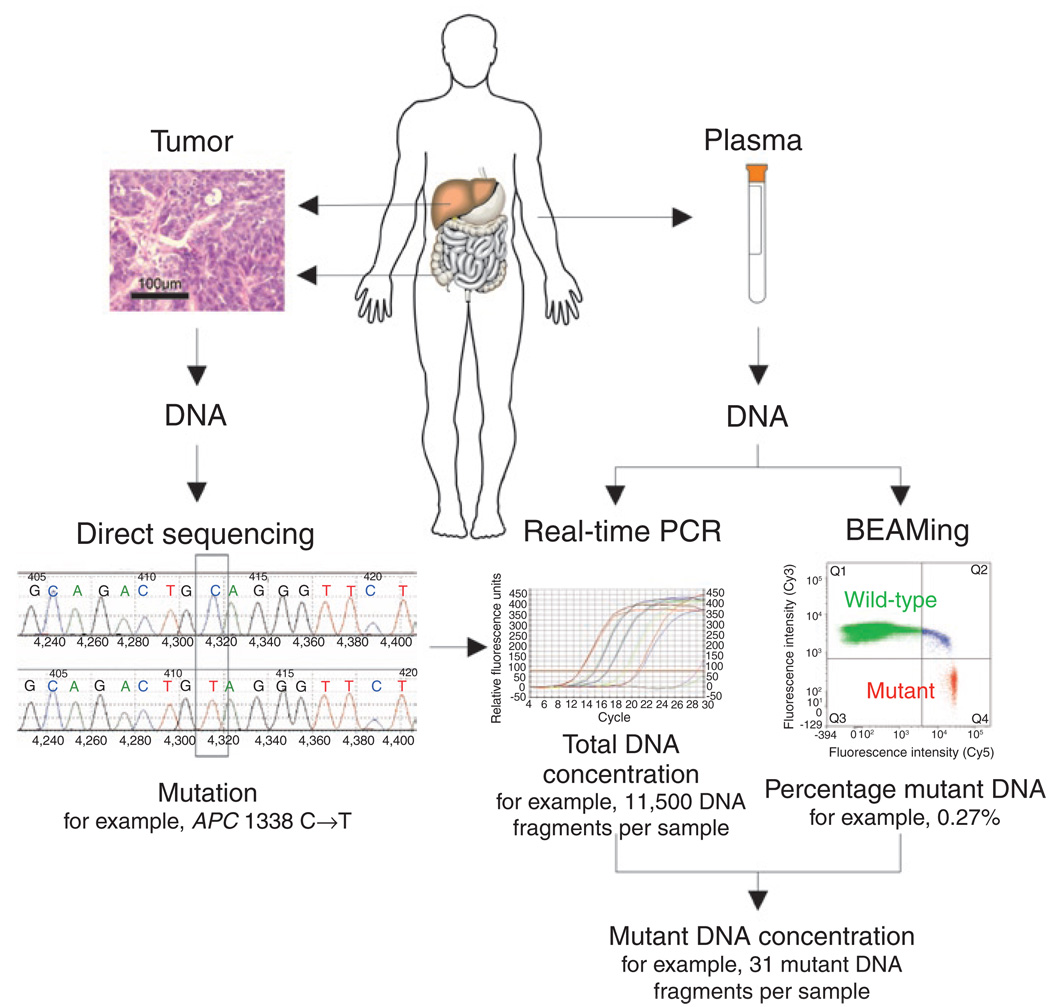
Figure 1. Measurement of ctDNA.
The left side of the schematic depicts conventional Sanger sequencing of DNA derived from the subject’s tumor, representing the first step of the analysis. The approach for quantifying tumor-derived DNA in plasma samples is shown on the right. Real-time PCR is used to measure the total number of DNA fragments in the plasma, whereas BEAMing measures the ratio of mutant to wild-type fragments labeled with the fluorescent probes Cy5 and Cy3, respectively.

