
Figure 1. Expression and regulation of FoxO family members in bone.
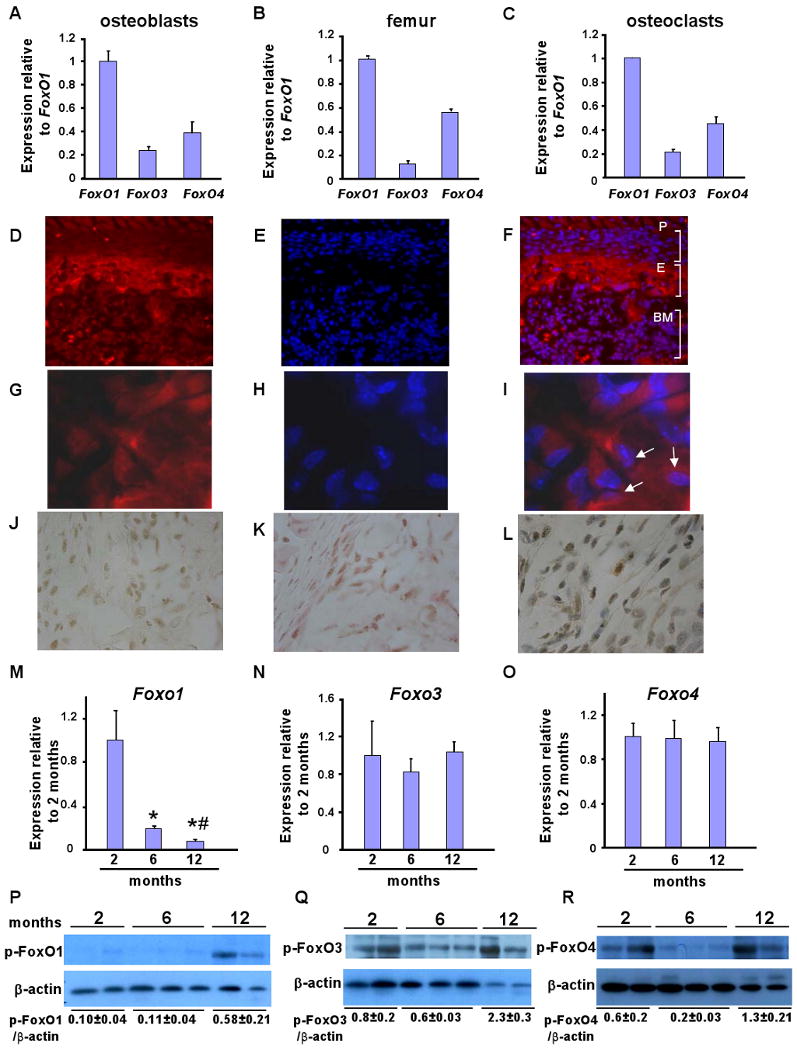
A-C) Expression of all the 3 FoxO genes in primary calvarial osteoblasts, femurs and osteoclasts of WT mice by real-time PCR (n=4 mice/group and duplicates were performed for cell extracts). Bars indicate means ± sem. Expression levels are relative to FoxO1. FoxO1 expression has been considered 1. Mice were 2 months old.
D-L) Immunohistochemical localization of FoxO1 in femoral sections of newborn WT mice. (D,and G) Images of bone sections depicting FoxO1 staining at 40× and 100× magnification. (E and H) Sections were counterstained with DAPI. (F and I) FoxO1 and DAPI images were overlaid to visualize nuclear and cytoplasmic localization of FoxO1 at 40× and 100× magnification. Arrows indicate representative cells showing nuclear localization of FoxO1 (purple). (J) DAB staining of FoxO1 in femoral sections. Adjacent sections were stained with FoxO1 and counterstained with (K) eosin or L) hematoxylin (100× magnification). P indicates periosteal surface; E indicates endosteal surface; and, BM indicates bone marrow. The 100× magnification images are obtained from the endosteal surface.
M, N and O) Expression analysis of all the 3 FoxO isoforms in murine bones collected from different ages (n=4 mice/group). * p < 0.05 (6 months vs. 2 months); # p < 0.05 (12 months vs. 6 months). Expression levels are relative to FoxO expression at 2 months of age. Expression at 2 months of age has been considered 1.
P, Q and R) Activity assessment by phosphorylation status of FoxO1, FoxO3 and FoxO4 in bones collected from mice of different ages. See also Figures S1 and S2.