Figure 6.
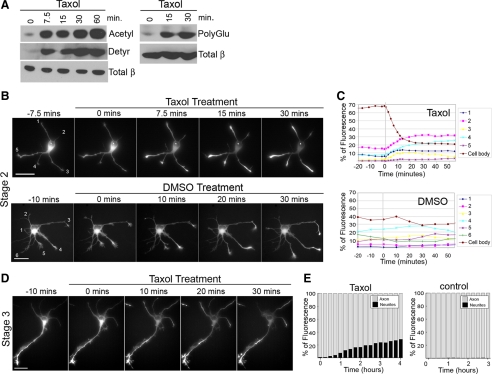
Taxol-induced alterations in CA-Kinesin-1 trafficking and tubulin PTMs occur on the same time scale. (A) A mix of stage 2/3 hippocampal neurons were treated with 100 nM Taxol for the indicated times. Cell lysates were analyzed by western blotting with antibodies to acetylated α-tubulin, detyrosinated α-tubulin, and total β-tubulin (left) or polyglutamylated α-/β-tubulin and total β-tubulin (right). (B and C) Time course of CA-Kinesin-1 accumulation in stage 2 cells. (B) Unpolarized, stage 2 hippocampal neurons expressing CA-Kinesin-1-mCit motors since the time of plating were analyzed by time-lapse microscopy before and after 0–30 min of treatment with 100 nM Taxol (top) or DMSO vehicle (bottom). (C) Quantification of the mCit fluorescence in each neurite over time for the cells in (B). The data are expressed as the percentage of total mCit fluorescence in each neurite and the cell body. (D and E) Time course of CA-Kinesin-1 accumulation in polarized, stage 3 cells. (D) Polarized, stage 3 cells expressing CA-Kinesin-1-mCit were analyzed as described in B. (E) Quantification of the localization of CA-Kinesin-1-YFP over time in a stage 3 control cell and a cell treated with 10 nM Taxol. The data are expressed as the percentage of YFP fluorescence in the axon and minor neurites at times after addition of Taxol. Bars, 20 μm.

