
Figure 3.
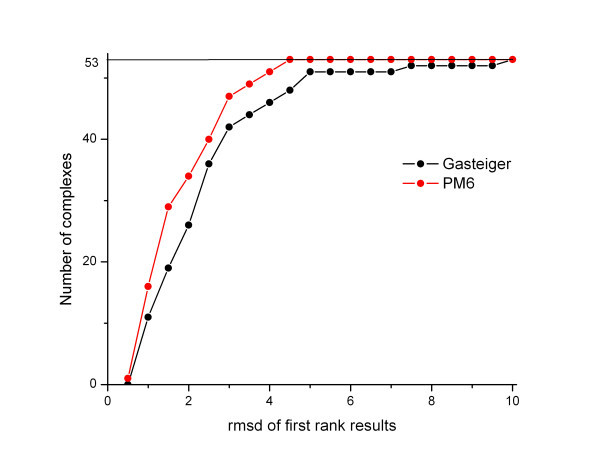
Performance of the PM6 charge calculation in docking experiments, compared to Gasteiger method. The graph shows the number of complexes within a given RMSD of the crystallographic structure. In each case, the conformation of the most favorable estimated energy is used as the predicted conformation.