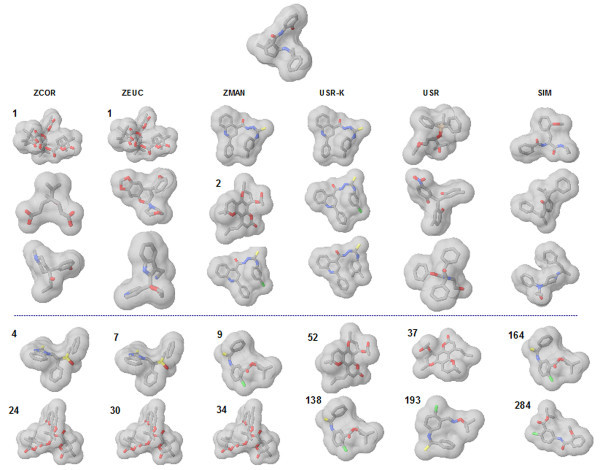
Figure 5.

Illustration of the case where the 3DZD retrieves more hits in the top 100 as compared to SIMCOMP and USR. The query is indicated at the top of the figure. For each of the distance metrics used, five molecules are shown. The first three molecules in each column are the top ranked molecules. And the last two shown in the fourth and the fifth rows are two next highest ranked active molecules. Active molecules are identified as those with numbers (in bold) which indicate the ranks. ZCOR, ZEUC, and ZMAN, 3DZD using the correlation coefficient, DE, and DM, respectively; USR-K and USR, USR with/without kurtosis; SIM, SIMCOMP.
