
Figure 4.
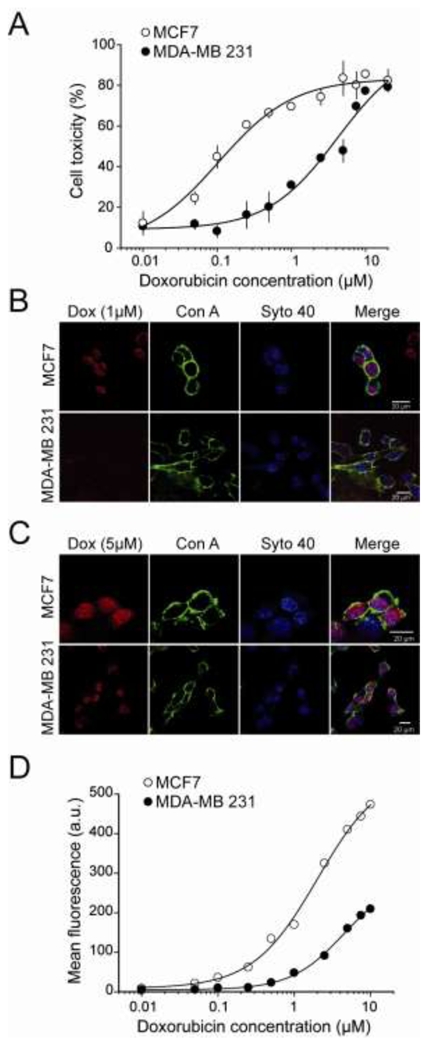
Study of free Dox cytotoxicity and accumulation in MCF7 and MDA-MB 231 cell lines. (A) Dose-response curve evaluating Dox cytotoxicity by the MTT assay on MCF7 and MDA-MB 231 cells. Dox incubation time with cells was 24 hrs. Data were fitted with sigmoid functions and yield EC50 values of 0.10 ± 0.02 μM (MCF7) or 2.7 ± 1.4 μM (MDA-MB 231) and maximal toxicity of 83.4 ± 5.0% (MCF7) and 90.7 ± 17.1% (MDA-MB 231). (B) Representative confocal images of MCF7 (upper panels) and MDA-MB 231 cells (lower panels) showing Dox (red), Con A (green) and Syto 40 (blue) labelling, as well as merge pictures. Incubation time of 24 hrs with 1 μM Dox. (C) Same as in (B) except for a Dox concentration of 5 μM. (D) Dose-response curve evaluating Dox accumulation in cells by FACS analysis of MCF7 and MDA-MB 231 cells. Dox incubation time with cells was 24 hrs. Data were fitted with sigmoid functions and yield EC50 values of 1.56 ± 0.21 μM (MCF7) or 2.92 ± 0.28 μM (MDA-MB 231) and maximal fluorescence values of 442 ± 20 a.u. (MCF7) and 200 ± 9 a.u. (MDA-MB 231).