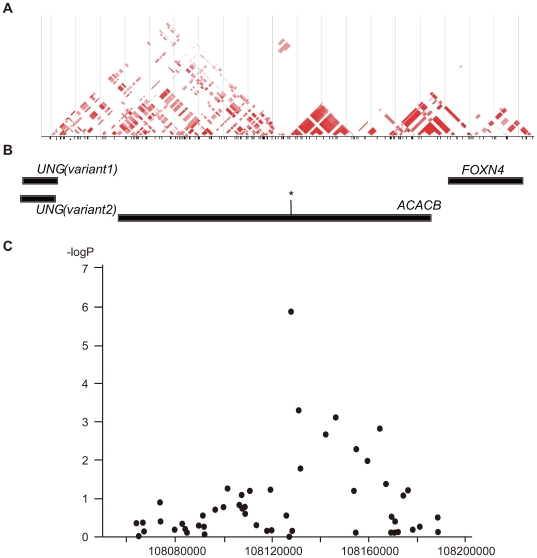
Figure 1. Schematic view of the association of SNPs in the ACACB region with diabetic nephropathy.
(A) Pairwise correlation structure at a 200-kb interval around SNP rs2268338 analyzed by Haploview (Haploview: http://www.broadinstitute.org/haploview/haploview). The plot includes pairwise r2 values from the HapMap release 24 for the JPT population. (B) Genes located at this locus. The asterisk indicates the SNP rs2268388 at intron 18 of the ACACB. (C) Results of a case-control association study for diabetic nephropathy in 754 Japanese individuals with type 2 diabetes having overt proteinuria and 558 control individuals with type 2 diabetes and normoalbuminuria. The log10-transformed p values for an additive model are plotted on the Y-axis. The X-axis indicates chromosomal position at this locus.

