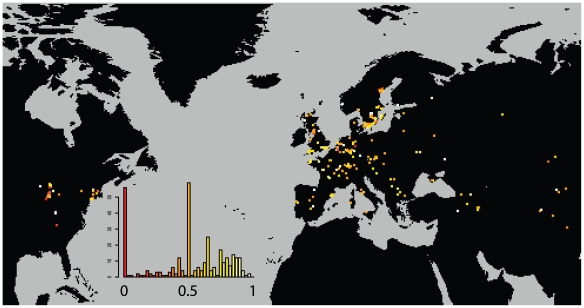
Figure 4. Distribution of haplogroup diversity by field site.
Probability of two plants in a field site being of different haplogroups. Low values (red) indicate monomorphic field sites. High values (light) indicate diverse field sites. A dynamic map will be available online at (http://arabidopsis.usc.edu/Accession/).

