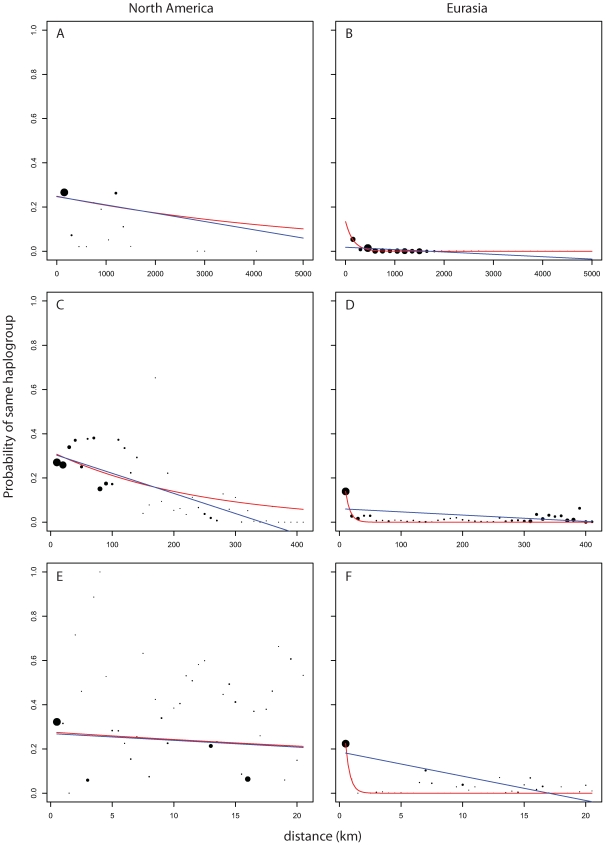
Figure 5. Probability of finding two members of a haplogroup as a function of distance and continent.
Dot size shows relative (within panel) number of observations per bin. Blue line is curve of the form y = mx+b that is best fit to the binned data. Red line is model of exponential decay of the form y = Cexp(−λ*x) that is best fit to the binned data. (A,B) use 150 km bins. (C,D) use 10 km bins. (E,F) use 1/2 km bins.

