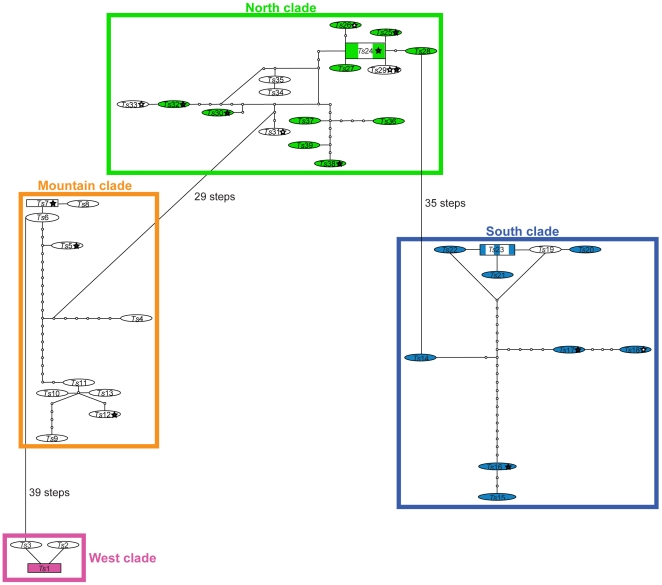
Figure 2. Minimum spanning network calculated by TCS 1.21 using mitochondrial COI sequences.
Haplotypes with the highest ancestral probability are displayed as squares, while other haplotypes are displayed as ovals. Shaded boxes/ovals represent urban samples, hollow stars are monogynous colonies, filled stars are polygynous colonies, and colors correspond to Figure 1. Colored boxes define networks identified with 90% probability of parsimony. Connections between networks were determined through decreasing the probability to a minimum of 60%.

