Figure 2.
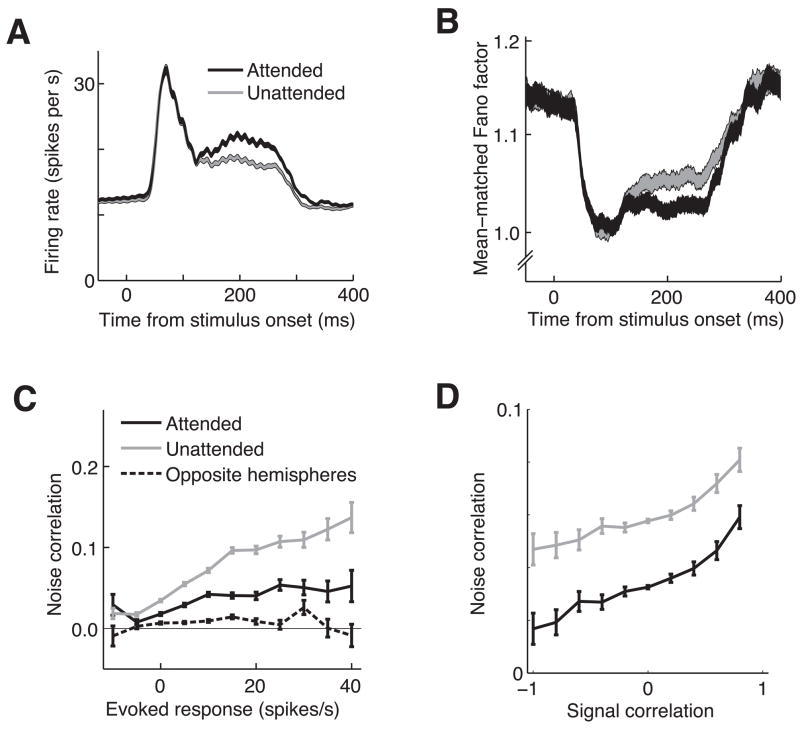
Attentional modulation of firing rate, Fano factor, and noise correlation. A. Attention increases firing rates. Peri-stimulus time histogram of firing rates for all 3,498 single neurons and multiunit clusters on trials when the stimulus in the same hemifield as the neuron’s receptive field was attended (black line) or unattended (grey line). Line width represents the SEM. B. Attention decreases mean-matched Fano factor. Plotting conventions are as in A. C. Attention decreases noise correlation. Spike count noise correlation (for responses over the period from 60 to 260 ms following stimulus onset) is plotted as a function of the mean stimulus modulation for the pair of neurons (firing rate during the stimulus – firing rate during the interstimulus blank period). For pairs of neurons in the same hemisphere, correlation was lower when the stimulus in the neurons’ receptive field was attended (black line) than when it was unattended (grey line). Pairs of neurons in opposite hemispheres (dashed lines) had correlations that were close to zero. Error bars represent SEM. D. Raw noise correlation, but not attentional modulation, signal correlation depends on signal correlation. Mean noise correlation is plotted as a function of signal correlation, which can be thought of as the similarity in spatial and feature tuning of the two neurons (see Methods). As has been previously reported, noise correlation increases with signal correlation. However, the difference in correlation between the attended (black line) and unattended (grey line) conditions did not depend on signal correlation. Error bars represent SEM.

