
Figure 3.
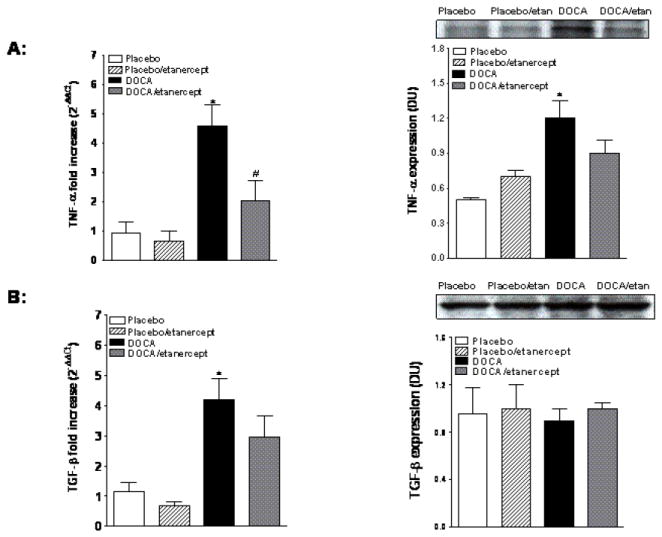
Renal cortical TNF-α and TGF-β mRNA and protein expression in placebo and DOCA-salt treated rats (A and B, respectively). Values are means±SEM. * P< 0.05 vs. placebo group and # P< 0.05 vs. DOCA-salt group.
Official websites use .gov
A
.gov website belongs to an official
government organization in the United States.
Secure .gov websites use HTTPS
A lock (
) or https:// means you've safely
connected to the .gov website. Share sensitive
information only on official, secure websites.
Renal cortical TNF-α and TGF-β mRNA and protein expression in placebo and DOCA-salt treated rats (A and B, respectively). Values are means±SEM. * P< 0.05 vs. placebo group and # P< 0.05 vs. DOCA-salt group.