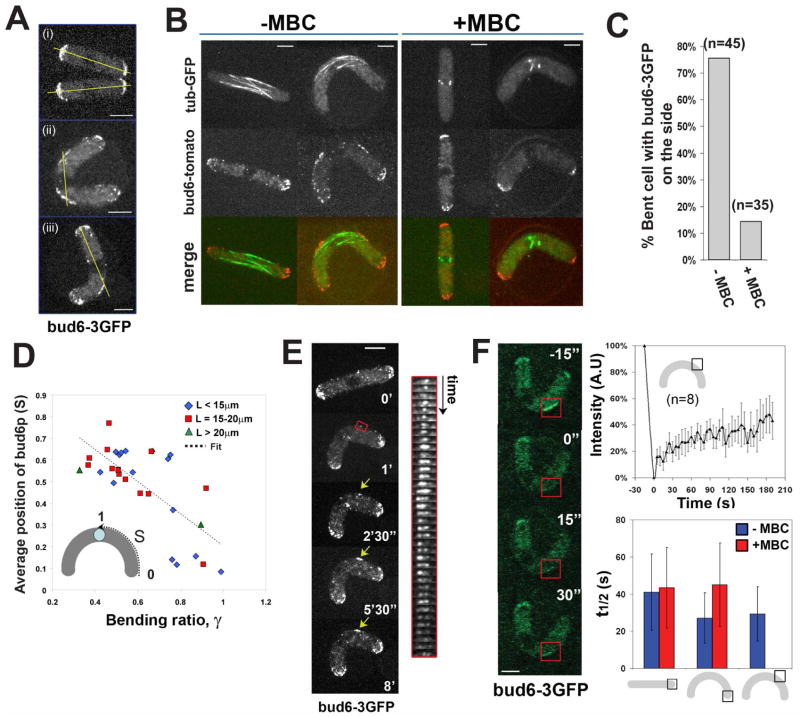
Figure 3. Initial recruitment of the polarity factor bud6p is MT-dependent.
(A) Bud6-3GFP localization in (i) straight and (ii and iii) bent fission yeast cells. The yellow line represents the predicted axis of MT growth from the nucleus. Strain: NM01 (cdc25-22 at 25°C). (B) Bud6-tomato and GFP-tubulin in straight and bent cells in the absence and in the presence of 50μM MBC. Strain: NM42 (cdc25-22 at 25°C). (C) Proportion of cells having bud6-3GFP specifically on the side, in the absence and in the presence of 50μM MBC. (D) Average position of the center of the bud6-3GFP band along the cell outer curvature as a function of the bending ratio. The linear fit returns Sbud6 = 0.95 – 0.74γ. (E) Time-lapse images of bud6-3GFP recruitment to the cell side upon bending of the cell (indicated by the yellow arrow). The kymograph follows the region of the cell in the red box, with a time interval of 30s. Strain: NM01. (F) FRAP experiments on bud6-3GFP. Time-lapse imaging of bud6-3GFP on the cell side recovering from photobleaching. Fluorescent intensity of bud6-3GFP on the cell side as a function of time during a FRAP experiments; the plot represents the average of 8 experiments on 8 different cells, and the bars represent the standard deviation for each point. Half-time recovery are shown for FRAP experiments of bud6-3GFP in the depicted configurations, in the absence and in the presence of 50μM MBC (in the presence of MBC bud6-3GFP is not targeted to the cell side). Strain: NM01. Scale bars: 5μm.

