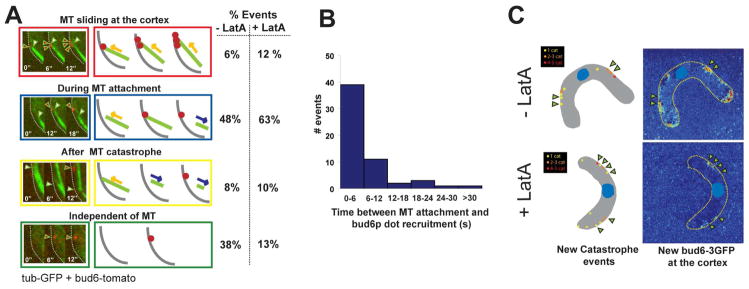
Figure 4. Recruitment of bud6p by MT contact.
(A) Dynamics of bud6p recruitment upon MT contact. Left: Single focal plane, two-color imaging (6s intervals) of GFP-tubulin and bud6-tomato on the outer curvature of a bent cell. Right: Schematics of the different observed relationships between MT contact and bud6p-dots recruitment. Far right: Proportion of these observed events in the absence (n=52) and in the presence (n=60) of LatA. (Note that in most cases, MT contact led to a bud6p dot recruitment) (B) Histogram representing the time between a MT attachment on the cortex and the appearance of a bud6p dot. Two color single focal planes were used to compute these data, the binning corresponds to the error in the measurement. (C) Colocalization studies of MT catastrophe and new bud6p deposition in bent cells in the absence and in the presence of LatA. Two-color 3D confocal time-lapse images of cells expressing GFP-tubulin and bud6-tomato were acquired for about 10 min with a 30s temporal resolution. MT catastrophe mappings in these cells are depicted on the left side. Bud6-tomato addition is computed by subtracting the first image from the average image of the entire time-lapse and represented using Matlab. Arrowheads indicate bud6p deposition colocalizing with catastrophe sites. Strain: NM42.

