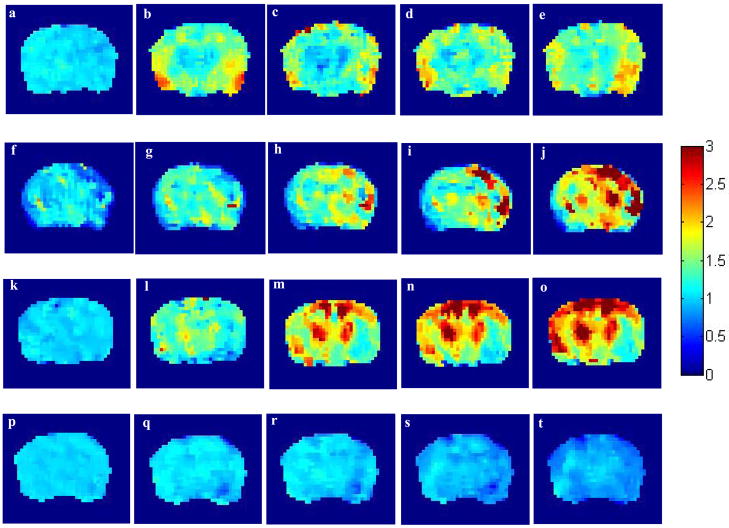
Figure 2.

2A. Effect of intraamygdalar (i.a.) infusion of excitatory amino acids and normal saline on cerebral blood flow. Individual animal examples for a–e) ATPA, f–j) AMPA, k-0) KA and p–t) saline acquired at intervals of approx 12–15 mins. The left-hand image in each sequence is the baseline (pre-injection) scan. The color bar shows the range of CBF increases with a maximum of approximately three times baseline.
2B. Effect of intravenous (i.v.) infusion of kainic acid and normal saline on cerebral blood flow. Individual animal examples for a–e) KA, f–j) saline acquired at intervals of approx 12–15 mins. The left-hand image in each sequence is the baseline (pre-injection) scan. The color bar shows the range of CBF increases with a maximum of approximately two times baseline.

