
Figure 3.
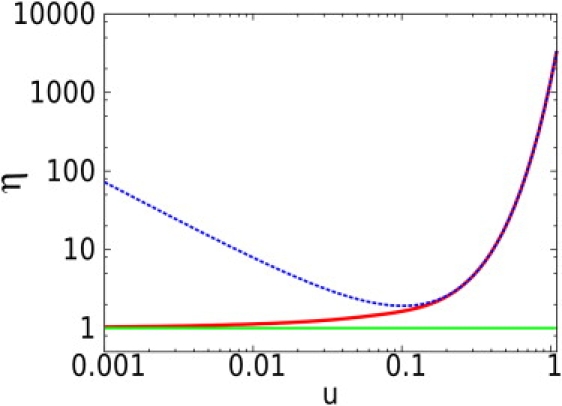
Representation in log-log scale of the evolution of the lowest achievable relative uncertainty η (solid red line) with respect to the confinement u for a square domain and N = 1. The figure also shows asymptotic approximations for free diffusion (solid green line) and high confinement (dashed blue line), exhibiting the dramatic increase of the uncertainty for high confinement. Note that to obtain the evolution of η for N > 1, a factor needs to be subtracted.