
Figure 4.
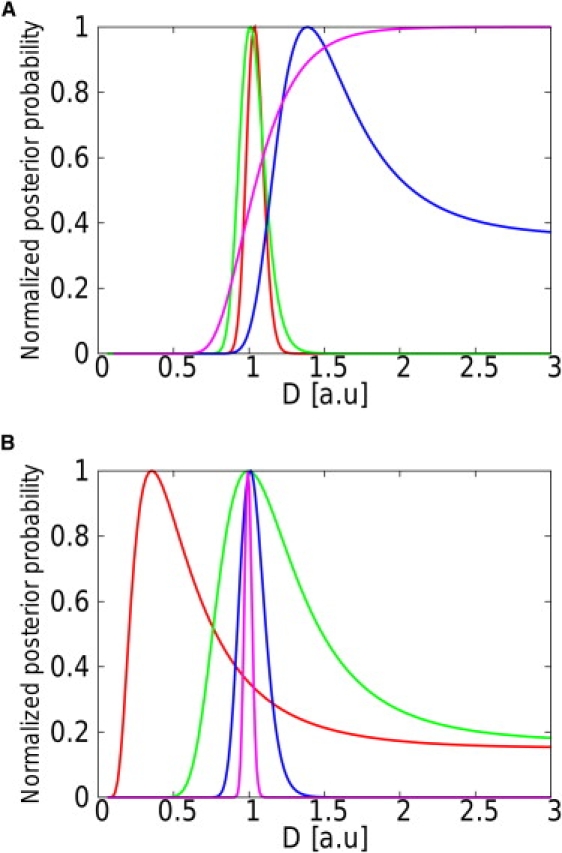
Representation of the evolution of the posterior probability with D for different realizations of the random walk confined in a square domain. The simulations were performed with a.u. (A) Evolution of the posterior probability for different levels of confinement u (u = 0.5, purple; u = 0.25, blue; u = 0.2, green; u = 0.1, red) and a given number of steps (N = 103). These levels of confinement would be obtained in experiments with D = 0.05 μm2.s−1, L = 100 nm, and, respectively, Δt = 100 ms, Δt = 50 ms, Δt = 40 ms, and Δt = 20 ms. (B) Evolution of the posterior probability for different numbers of steps (N = 10, red; N = 100, green; N = 1000, blue; N = 10,000, purple) and a fixed level of confinement (u = 0.2). Realistic experimental parameter values corresponding to this level of confinement could be D = 0.05 μm2.s−1, L = 100 nm, and Δt = 40 ms. The convergence of the estimation toward the actual value of the diffusivity is observed.