
Figure 5.
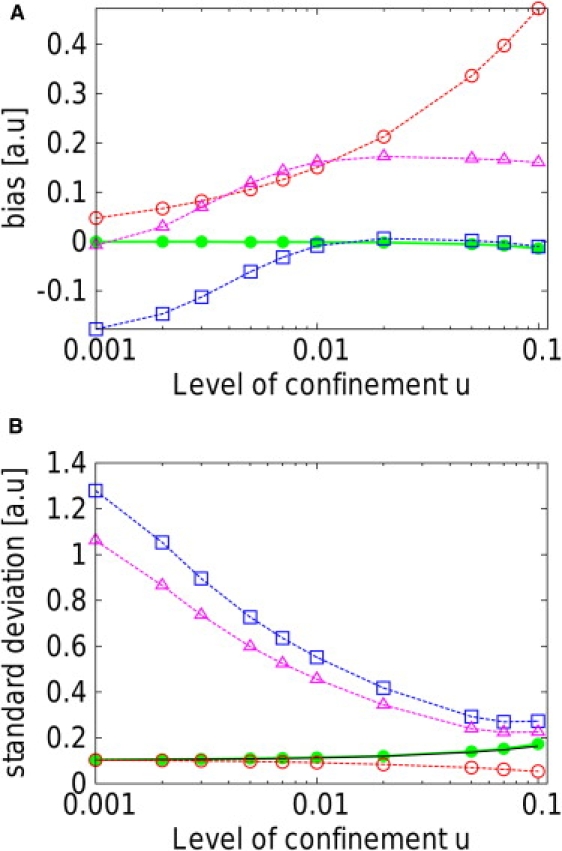
Representation of the bias (A) and standard deviation (B) of the MAP and MSD estimators with respect to the level of confinement u, for N = 100 time steps. For each u, ∼105 trajectories were used to evaluate these quantities. (MAP estimator, solid green lines; MSD(1), dashed red lines; MSD(2), dashed blue; and MSD(3), dashed purple.) The bias is defined as the difference between the actual value of the diffusivity used in the simulations ( a.u.) and the average value of the estimations made using a given estimator. Only the MAP estimator is unbiased over the whole range of levels of confinement. The lowest achievable standard deviation of the estimations, the Cramér-Rao bound, is represented as the solid black line. The performances of the MAP estimator are practically identical to the theoretical Cramér-Rao bound. All MSD estimators are either largely biased or less efficient than the MAP estimator.