
Figure 6.
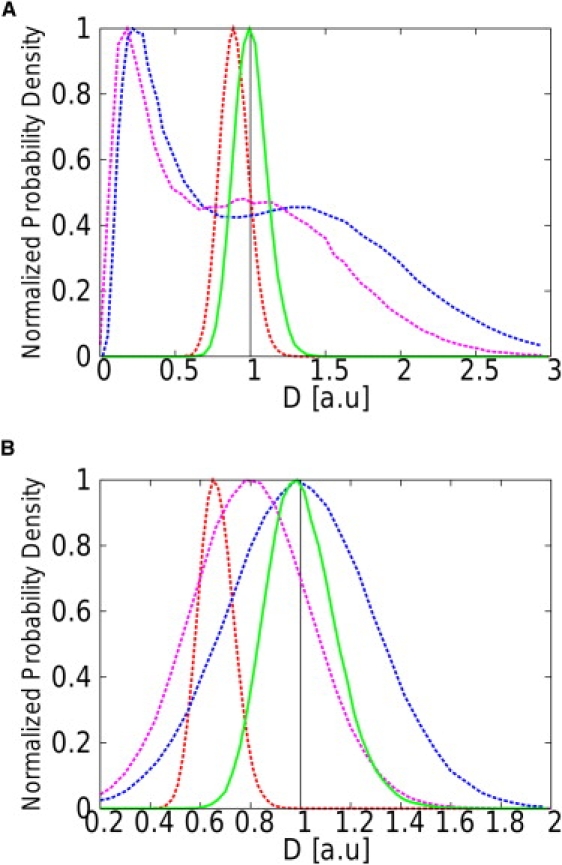
Normalized distributions of the estimations , , , and DMAP made using the four studied estimators for N = 100 steps and two different values of the confinement level: u = 0.005 (A) and u = 0.05 (B). (MAP estimator, solid green lines; MSD(1), dashed red lines; MSD(2), dashed blue; and MSD(3), dashed purple.) The vertical black line is positioned at the actual value of the diffusivity ( a.u.). The MSD estimators are either biased or less efficient than the MAP estimator.