
Figure 7.
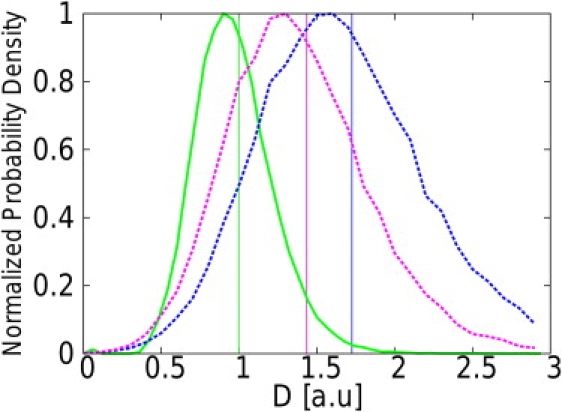
Normalized distributions of DMAP, , and estimates obtained from 105 trajectories with a confinement level u = 0.05 and a noise with standard deviation σ = 0.15 a.u. The trajectories were generated with a diffusivity a.u., L = 1 a.u., Δt = 0.05 a.u., and N = 100 steps. For such a level of confinement, realistic experimental parameter values would be D = 0.05 μm2.s−1, L = 100 nm, and Δt = 10 ms. The precision on the position would then be σ = 15 nm. This noise level corresponds to a relative uncertainty of 50% on the position of the particle with respect to the mean one-dimensional displacement . (MAP estimator, solid green line; , dashed blue; and , dashed purple.) A vertical line is positioned at the mean value of the distribution with the corresponding color. The distributions of and are shifted toward higher values of the diffusivity under the effect of noise.