
Figure 1.
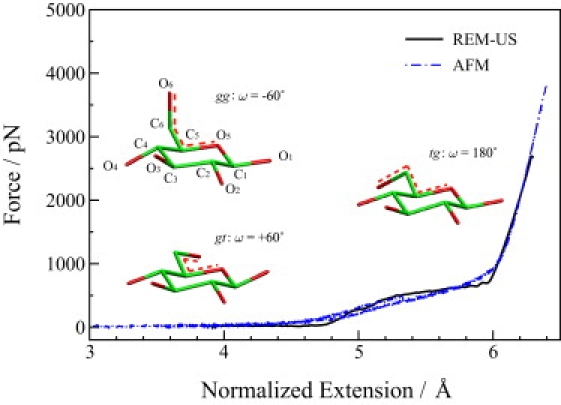
Comparison of force spectra obtained from the REM-US simulations (black solid line) and AFM experiments (blue dash-dot lines) (43). Three major conformations involved in the stretching process are shown in the plot, corresponding to the rotamers: gauche-gauche (gg), with the dihedral angle O6-C6-C5-O5 (denoted by the red dashed lines in the molecules), ω = −60°; gauche-trans (gt), with ω = +60°; and trans-gauche (tg), with ω = 180°.